Last week during our afternoon workshop, New West Council received a presentation by representatives of Metro Vancouver’s Regional Planning Services. They were here to talk about the upcoming update to Metro2040, the Regional Growth Strategy, eloquently labelled Metro2050.
The Regional Growth Strategy is the highest-level planning document in the region. All municipalities have some form of master planning document, be it an Official Community Plan or a collection of Neighborhood Plans that lay out in broad strokes what the vision is for the community over the decades ahead. This is important, because it allows government and utilities to plan new roads, water and sewer lines, recreation facilities, emergency services, schools, and all of the things that should, ideally, be planned out before they are needed. It also helps guide policy assures communities have the right mix of housing types, commercial and institutional land, and green space. Without a well-understood plan, we cannot develop the robust policy needed to shape the outcomes we are looking for.
All the municipalities in Metro Vancouver agreed upon and ratified the Metro 2040 plan back in 2011, and all of our subsequent Official Community Plans (including the OurCity 2041 plan adopted by New West in 2017) include a context statement that links it to the greater regional plan. This is because all of the things I listed above (roads, utilities, etc.) need to be planned at a regional level if we hope to have a livable region. Every community shares our regional sewer system (for example), and the growth of the region relies on significant investment in new sewer infrastructure – not just pipes in the ground, but billions of dollars in wastewater treatment plants that need to be planned out a decade or more in advance. To make that work, we need to know where the houses, the apartments, the breweries and the shopping malls Amazon Fulfillment Centres are going to be when that plant is operating. That’s the essence of planning.
As we start looking at Metro2050, I wanted to get an idea of how we were doing on Metro2040. One of the easiest things to evaluate looking at that strategy is how growth was distributed across the region. If you look at Appendix A of Metro2040, you see population growth projections for the region by decade:
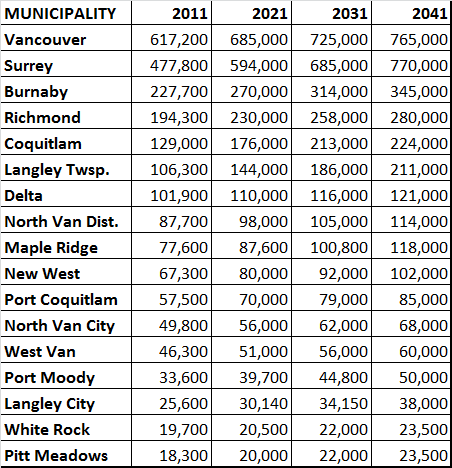
As we are now almost a decade in, and are doing an update, I thought it might be useful to see how these projections turned out. Unfortunately, the best source for annual population estimates is not the Metro2040 Plan, but the annual stats collected by the Province (you can see them here), and they do not correlate perfectly with the Metro Numbers. Here are the BC Population Stats for 2011 and (most recently) 2019 for the municipalities above: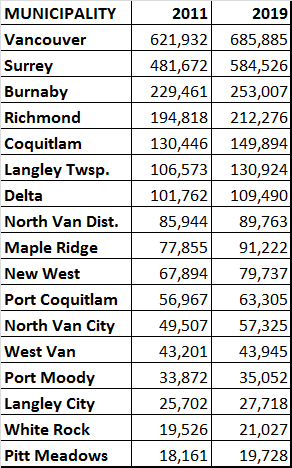
The numbers are not exactly the same as the Metro estimates, but we can compare the two sets by looking at the projected total growth (2011-2021) as a percentage of the 2011 population from Metro, and the estimated actual growth between 2011-2019 from the BC Government stats. Since that growth only includes 8 years, I projected forward two more years at the same rate of growth for each community – so which communities are on trend to meet their 2011-2021 estimates? The numbers may surprise you: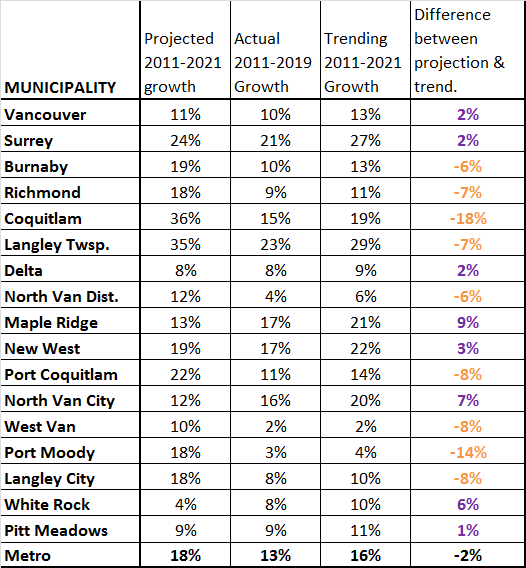
As you can see, the projected rate of growth of the Metro region over the decade was 18%, or about 1.7% annually. The actual growth from 2011 to 2019 was closer to 13% (or little over 1.5% annually), and if you project this trend forward to 2021, you get 16% growth. We over-estimated slightly.
Using the same baseline, you see vast differences around the region when communities are compared to their goals. White Rock, North Van City and Maple Ridge all grew much more than their projections, while Coquitlam and Port Moody were anomalously lower than their projected growth. Of course, this is compared to their projections, as Langley Township grew 7% less than projected, but was still the fastest growing municipality in the region at 29% growth, where Delta was one of the slowest-growing communities at 9% over the decade, but still exceeded its meagre growth projection.
There are, no doubt, local reasons for these trends. The fact the two newest communities in the SkyTrain family (Port Moody and Coquitlam) are the ones that lagged farthest behind may be related to how far behind projected opening the Evergreen Line was. Coquitlam seems to be catching up with significant growth around their new stations, though it seems Port Moody is on a different path. It is also interesting, if anecdotal, that many communities that had the most growth-related angst through the 2018 local elections, like White Rock, Port Moody and the District of North Vancouver, have some of the lowest actual population growth numbers. Having population growth rates of less than a half a percentage a year in this region is an anomaly worth exploring deeper as we look forward.
There is more info about the Metro2050 process, and ways you can get engaged here at the Metro2050 page. C’mon out, tell them what you think.