If you own a home in New West, you should have received your annual tax bill in the mail in recent weeks. If your assessment went up by the city-wide average of 9.03%, then your tax bill went up over last year by 5.28%. If your assessment went up by more than 9.03%, then your tax bill went up more. Conversely, if your assessment went up by less than 3.7%, or if it went down, then your tax bill this year is lower than it was last year. I tried to show how this works in this blog post from a couple of years ago (with the numbers from a couple of years ago, mind you).
It seems an appropriate time for me to update some of my older posts comparing New West tax rates to others around the region. I’ve done this a few times in a few different ways for several years on this blog (here, here, and here, for example), and no matter what type of analysis you do, it is clear that some local pundits continue to perpetuate terminological inexactitudes when they claim that New Westminster has the highest taxes in BC, or Canada.
Recognizing my own suspicion of bias, all of the data below comes from the BC Government reports that annually compare tax rates and burdens across all local governments, and have been doing so for a while. Of course, this data is from 2018 (Cities are only now submitting 2019 budget numbers to them), but this is the best source to compare numbers across the province. You can read them all here and make your own comparisons if you don’t like my ham-fisted Excel skills.
I am going to reiterate a point I have made before: there are many ways to compare taxes between jurisdictions. Vancouver and Surrey collect more tax overall than New West, because they are much larger. West Vancouver has lower mil rates because their average house price is much higher, Creston has a much higher mil rate because its average house value is much lower. Even the use of “typical house value” to compare taxes is biased, because some cities like New West have more people living in rental and condo buildings than some others, so a “typical house” is much larger and more expensive than the median or average household occupies. So to answer the primary question: do New Westminsterites pay more municipal taxes than residents of other municipalities, I think the fairest comparison is taxes collected per capita:
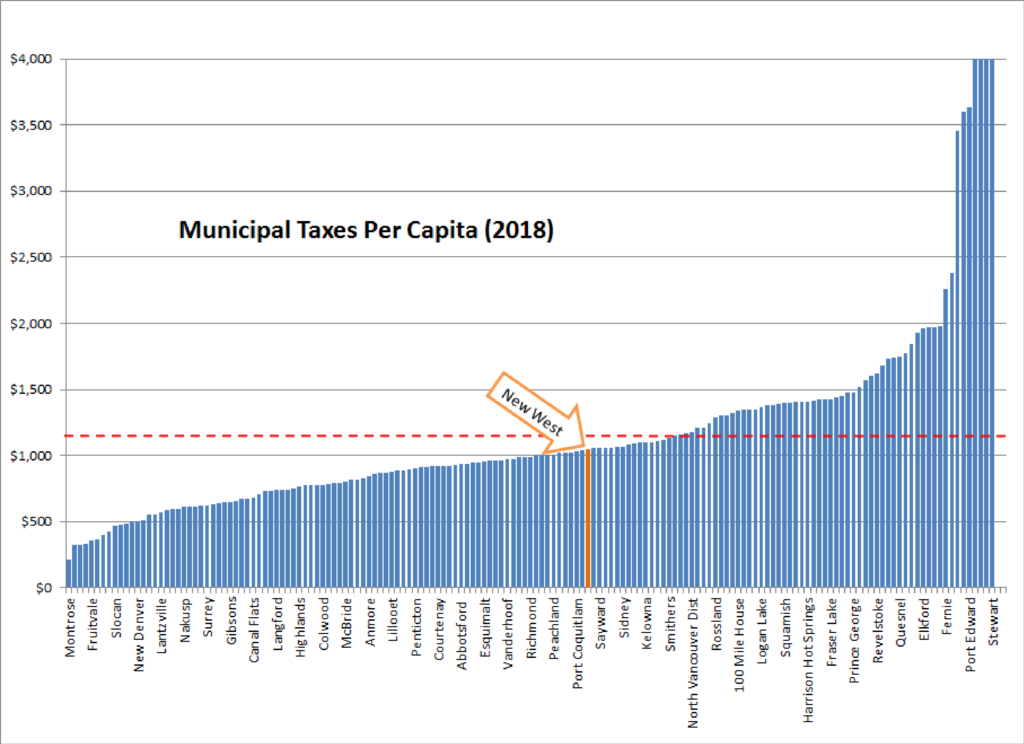
Of the 161 Municipalities in BC, ranked from highest taxes to lowest, New Westminster (orange bar above) is ranked #71, between Parksville (#70) and Saanich (#72). In 2018 we collected $77.7 Million in taxes from just under 74,000 people, making our per capita tax rate $1,051. Province-wide, $4.76 Billion in municipal taxes was collected from 4.3 Million people, making the province-wide average about $1,150 (red dashed line above). So New Westminster residents paid $100 less per year, almost 10% less, than the average resident of BC. Our tax increase in 2019 will eat into this gap, pushing us up by about $50, but at the same time, almost every other Municipality in the province increased their taxes at a rate between 2 and 7%, so our position will not shift substantially.
Naturally, there are massive differences across the province on the proportion of taxes paid by industry and businesses, and the level of services provided by the Municipality. The Lower Mainland is a bit different than the rest of the province in the level of services we supply and the cost of delivering those services, so it may be fairer to only compare New West to our Metro Vancouver cohort:
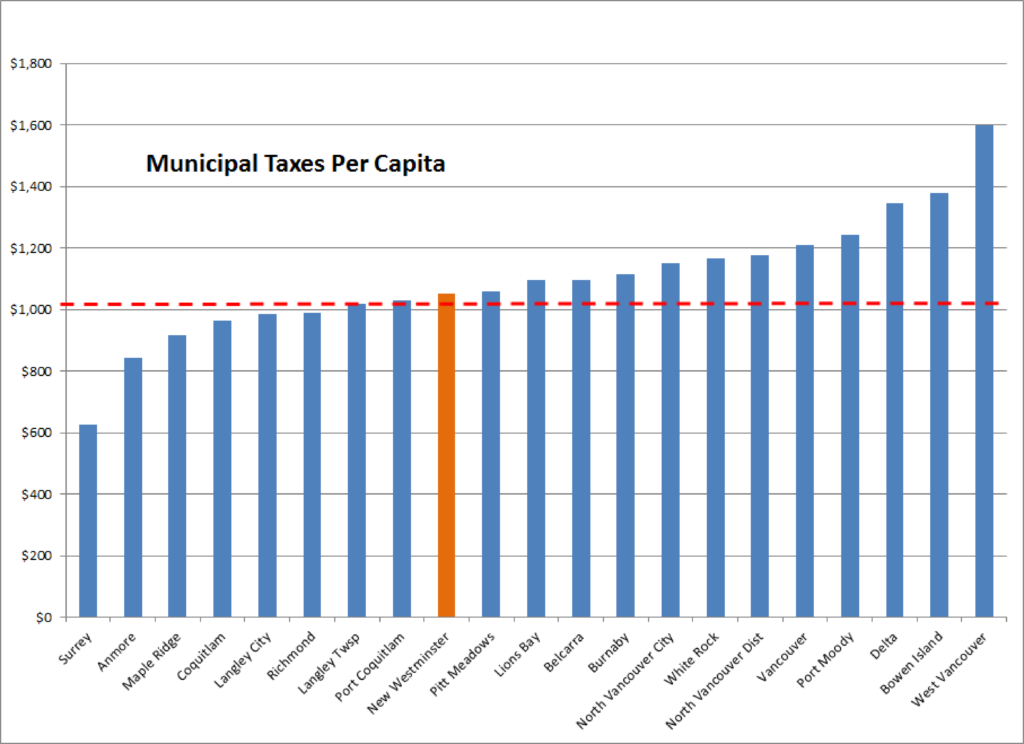
New Westminster ranks 13th out of 21 GVRD municipalities in taxes collected per capita. The GVRD Municipalities collect about $2.6 Billion in Municipal taxes from 2.56 Million people, for an average of $1019 per person (the red dashed line). New Westminster collects slightly more (3% more) than this average. This has changed over the last couple of years for two main reasons: New Westminster’s Capital Levy we are using to fund our aggressive capital renewal plan (lead by the replacement of the Canada Games Pool) and the regional trend where there is a much higher rate of population growth in the relatively low-tax municipalities of Surrey and Maple Ridge compared to slower growth in Vancouver and (especially) the North Shore. We can talk about correlation/causation here, because it might not be what you think…