A little while ago, I blogged about Property Taxes, and tried to put some context to where New Westminster compares regionally around residential property tax levels. I used this dataset provided by the Province, as comparing the financial documents of all 21 Lower Mainland municipalities from their on-line reporting is a bit of a challenge. I demonstrated (I think) that New Westminster is neither the highest of lowest taxes municipality, but was either in the top third (if you take a very raw measure) or right about in the middle (if you actually count how much the typical household or resident pays).
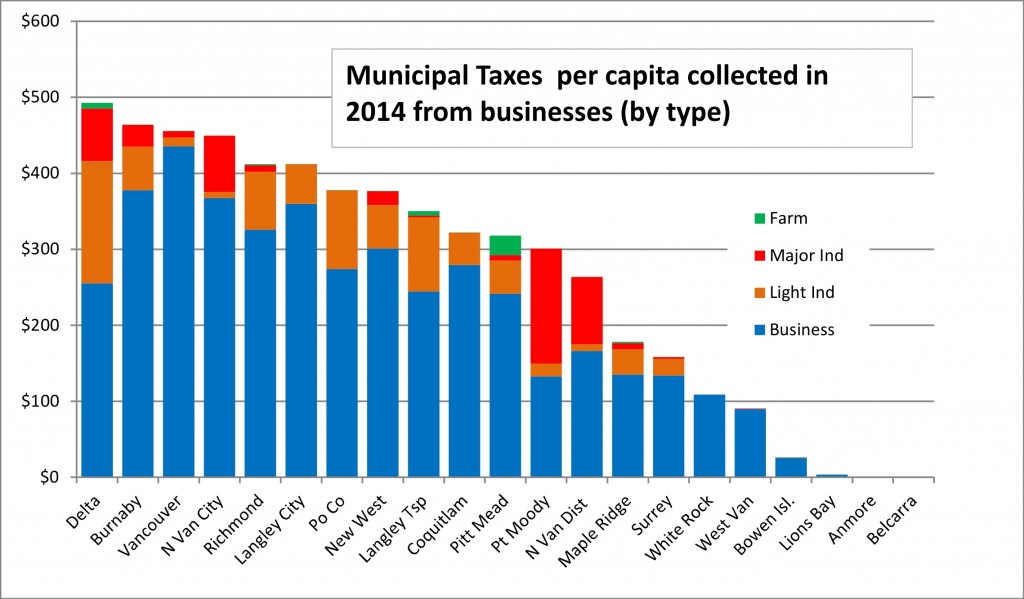
But what about businesses? During the last election, it was suggested in print by one of the (unsuccessful) candidates that taxes charged to businesses in New Wesmtinster are “the highest in Metro Vancouver”. This did not make sense to me at the time, but didn’t rise to the point, as I wanted to be able to put number to the issue. The simplest method, of course is to compare how much is collected from businesses of every type on a per-capita basis:
You can see that New Westminster is 8th in the crazy category of most taxes per capita from businesses of all types. If you look only at commercial businesses (blue), we are the 6th highest. This is where you can see some of land use choices affecting the numbers. Delta has huge tracts of industrial land on Annacis Island that provides almost half of its non-residential taxes, and Port Moody hosts a lot of major industrial use. Meanwhile, Vancouver is truly post-industrial, with their largest “industry” being non-industrial commercial businesses. There is nothing here that makes New Westminster anomalous.
However, this is a rather useless comparison. Unlike residential taxes, you cannot evaluate business taxes on a per-capita basis. With the varying levels of residential/business mix, you can’t really count up the number of businesses or business owners or leasable square footage and divide the taxes collected between those groups, as the variables are way too…uh…variable. So how do we compare apples in this diverse bowl of fruit?
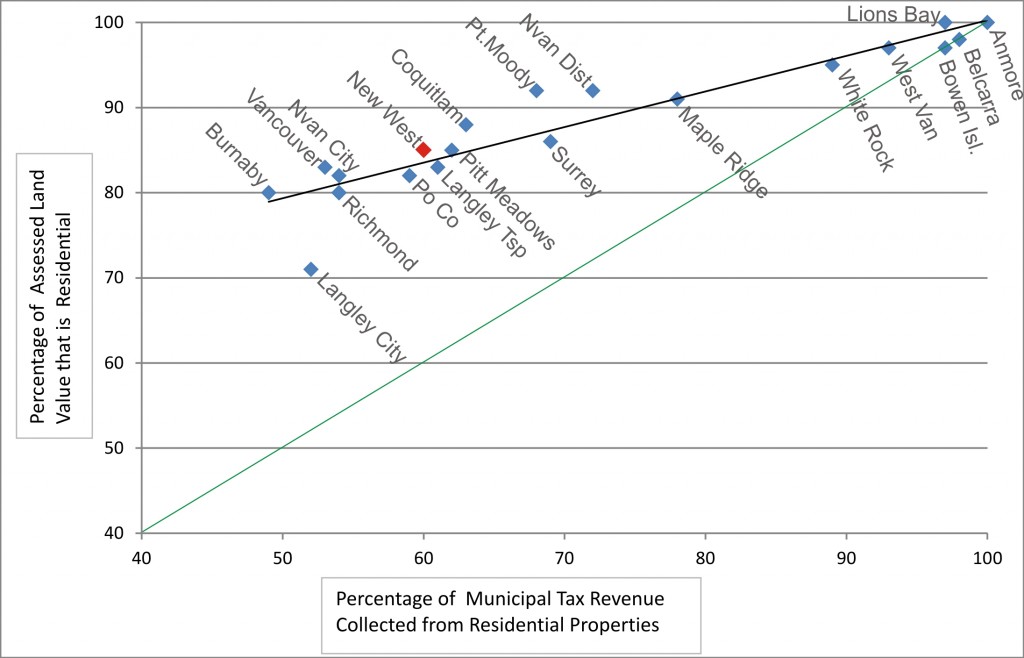
One way would be to look what proportion of the total property tax revenue is paid by residents, and what proportion is paid by businesses. To index this, you need to compare it to the proportion of assessed land value that is zoned Residential vs. that zoned Commercial. This allows you to recognize anomalies like Anmore and West Vancouver (which have almost all of their land in residential use) and compare them to places like Langley City and Port Moody, where commercial land use is proportionally large.
First, compare the percentage of land value that is in residential property with the percentage of tax revenue drawn from that residential land:
You can see that in Anmore 100% of the property is residential, therefore that is the only source of revenue. At the other end of the “best fit line” is Burnaby, where 80% of the land is residential, but only 50% of the tax revenue comes from residential taxes. Note the green line, which represents an even balance between proportion of residential land value and tax revenue. The best fit around which all municipalities cluster is well above that, which makes sense as all municipalities charge a higher Mil Rate for businesses and industry than for residents. The amount more they charge is the “Multiplier”.
In New Westminster, our Multipliers in 2015 are shown on the table below. The first number is just New Westminster taxes, the second includes all the School, GVRD, MFA, etc. taxes that the City has no real control over.
Property use Multiplier (City Only) (all taxes)
Residential x 1 x 1
Business x 3.475 x 3.403
Light Industry x 4.566 x 4.131
Heavy Industry x 8.102 x 6.444
But back to the graph above. If a municipality charges less to residents in proportion to their property value than they do to business and industry in comparison to other municipalities, then they appear below the best fit line. For lack of a less-pejorative term, I’ll call these municipalities “resident friendly”. Those above the line are more “business friendly”. Langley City is anomalously “resident friendly”, where North Van City and Port Moody are more “Business Friendly”.
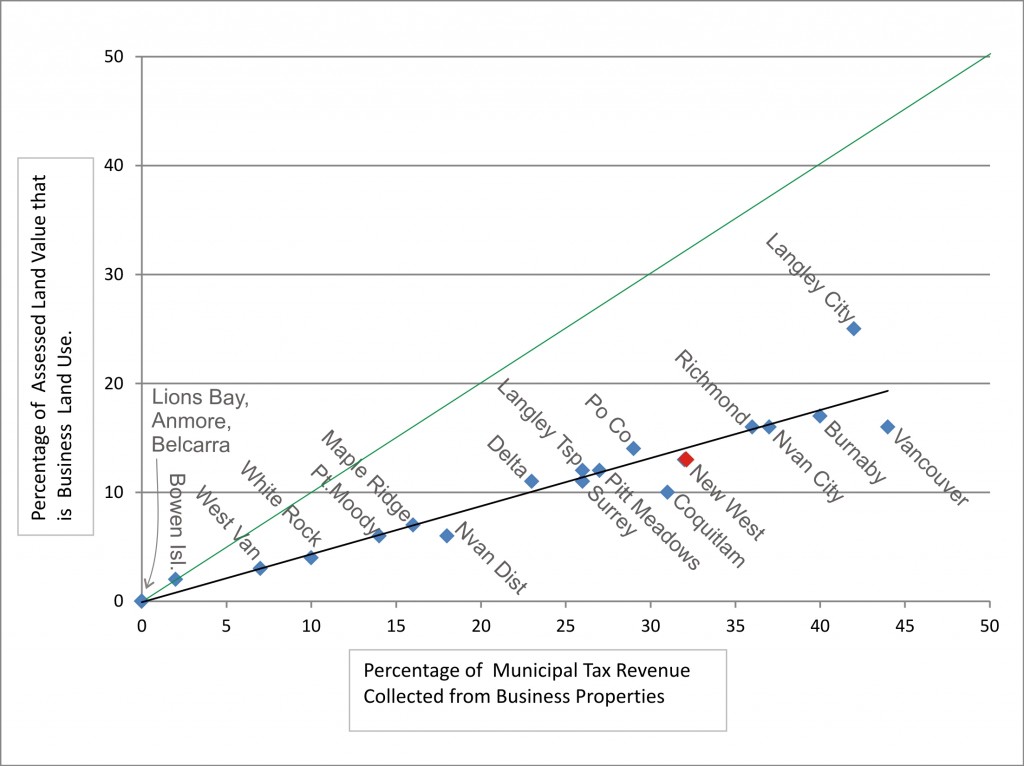
However, much of what controls the proportion of industrial land is structural to the economy and geography. Today’s Delta won the lottery in 1955 when the island was designated as the region’s first Industrial Park, and the high-multiplier property taxes started rolling in. Another way to look at the above graph is to flip it over looking only at commercial business taxes:
This time the best fit is under the (green) equality line because every business in every municipality pays more than its share of property taxes. The further under the best fit line, the less “business friendly” a Municipality may be considered. Vancouver is the obvious standout (the attractiveness for major businesses of being located at the central business district of the metropolis demands a premium), but New Westminster, Coquitlam, and the District of North Vancouver also appear a little below the line, and have very different land use proportions when looking at residential vs. industrial vs. commercial.
This raises a question which is completely rhetorical, but well worth asking: what should be the balance between residential and business taxation? Should a City like New Westminster give business owners a bit of a break to encourage job creation, or should we keep residential property taxes lower to manage the affordability of living here? Should businesses subsidize residents, or vice versa? If “neither”, what is the balance?
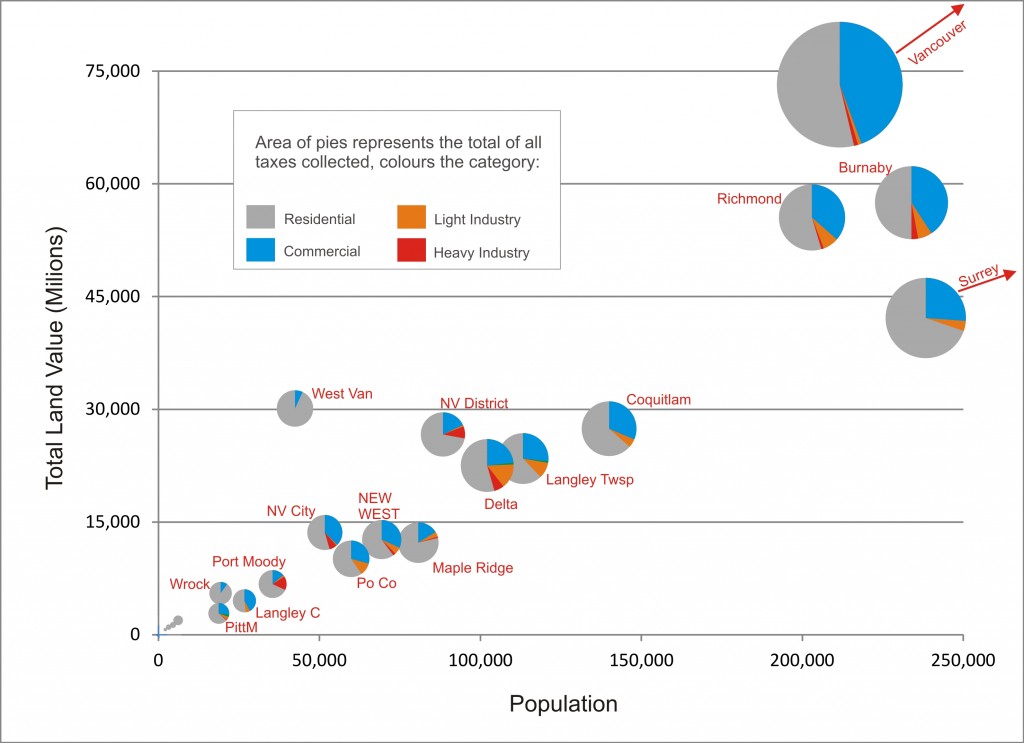
Just for the fun of it, I plotted every municipality’s details on the same graph. Population is on the X axis, and the total land assessed value on the Y axis. The area of the pies represent the annual tax revenue, and the colours of the pie charts represent the tax revenue by land use. Note that Vancouver and Surrey are both way off the chart here. Both their populations (640,914 and 504,661 respectively) and assessed land values ($221 Billion and $85 Billion) put them in a range that is out of scale with the rest of the graph.
I don’t have much to say about this graph except that New Westminster is snugly right in the middle on pretty much every measure. The amount of tax revenue collected and the proportion of residential vs. other types of taxation is pretty much right where you would expect for a City of our size and population. It is clear that we do not, by any measure, have the highest taxes in Metro Vancouver, nor are we the lowest, regardless of whether you are a business or a resident. We are somewhere in the middle, proportionate with our land use and population size.
All of this data is from 2014, and the new 2015 reporting to the Provincial government is starting to trickle in. This year, New Westminster Council approved a 2.42% tax increase, which is higher than the 1.3% increase in the Consumer Price Index over the fiscal year 2014-2015. This raises the question of whether our tax increases are happening at an anomalous rate. I’ll try to dig out some data for that and bring you a Part 3.


