For reasons that should be obvious to everyone by now, I have been talking to a bunch of people about “the transportation issues” in New Westminster. It has been fun, informative, sometimes perplexing, often frustrating. For every person suggesting simplistic short-term solutions, there is another calling for bloody revolution. Unfortunately, the suggestion of gradual improvement though better planning, application of the best practices from other jurisdictions, and working with our neighbours to solve the regional transportation puzzle sounds unsatisfying compared to those extremes.
A local twitter follower I respect greatly raised an interesting point a couple of weeks ago, asking a seemingly simple question out of the blue: “does anyone know percentage of metro Van covered in asphalt?” I was (almost) embarrassed to admit I had written the answer down less than 24 hours before he asked, but his question led me to do a little more digging, and I found the data interesting.
First, the reason I wrote the information down was my job. I was attending a meeting at Metro Vancouver where a version of this question was answered. The meeting was of municipal engineering and environmental staff from around the region, and the subject was stormwater management. As part of the regional Liquid Waste Management Strategy, Metro is helping the municipalities of the region set some planning priorities around how the manage their stormwater.
Efficiently moving rainwater from your street, roof, and back yard to the river or ocean so that is doesn’t flood your community is one of those big, expensive tasks that is almost invisible to most people, except the way it eats up your tax money. The amount of pavement covering the ground is important to stormwater management because rain that hits pavement doesn’t get absorbed and stored in the soil like it does if it falls in a park, the forest, or your back yard. Instead, it needs to be immediately dealt with by the storm sewer system. Also, rainwater that runs off of streets tends to get dirty, and is a major cause of pollution for sensitive estuarine and marine ecosystems near urban areas. Reducing this run-off, or encouraging natural filtration of parking lot run-off (for example) through bioswales or the such is one of those strategies that requires some investment in the short term, but can save Cities a lot of money in the long-term while improving the environment.
But I was talking about roads, so back to roads.
During this meeting, a pie chart went up on screen that showed how land use was divided up over the region, for the purposes of thinking about road run-off. The quick stat I wrote down was 17% of “developable” land was roads. After the fact, the Twitter question was raised, so I found the source data, and drew up my closest approximation of the pie charts we were shown. Note this is 2006 data I am using here, and I think the data I was shown at the meeting was 2011, so there will be a little change at the edges, but the major divisions are pretty clear.
Of all land in Metro Vancouver, here are the major land uses, of which “roads” (in red) equals about 7%:
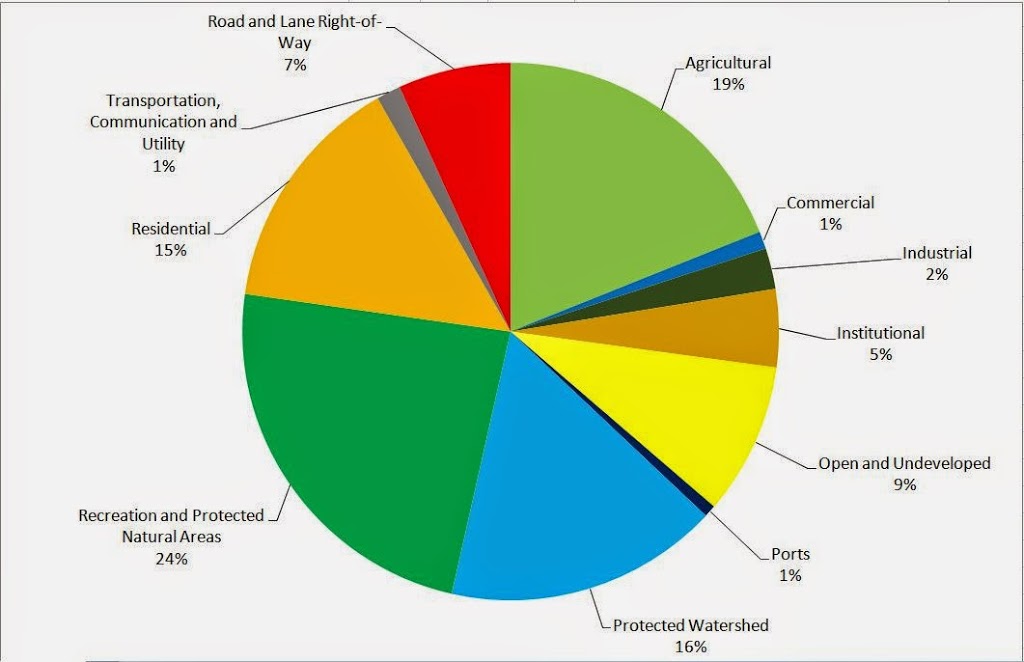 |
| Land use in Metro Vancouver, 2006, by area. Click to Enlarge. |
If you remove from consideration all of the land that is protected from development: Active ALR land, Watersheds, Parks and Protected Natural areas, you end up with 17% of the “developable” lands being roads:
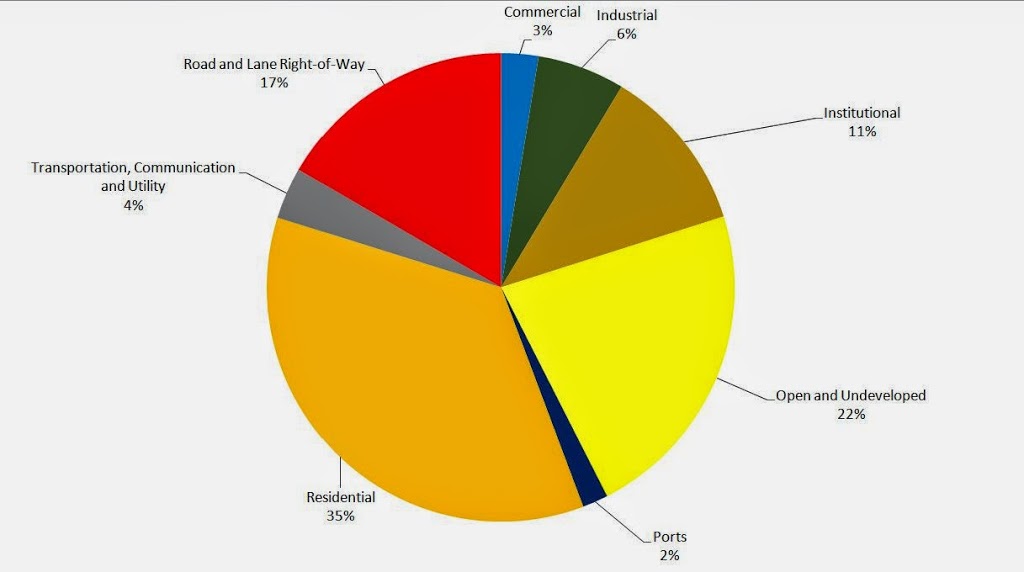 |
| Land use for “developable” land in Metro Vancouver, 2006, by area. Click to Enlarge. |
The reason I am using 2006 data is because Metro Vancouver very kindly broke it up into Municipalities, so you can play compare and contrast. Turns out the City with the highest proportion of roads? If you guessed New Westminster, you know where I am going here:
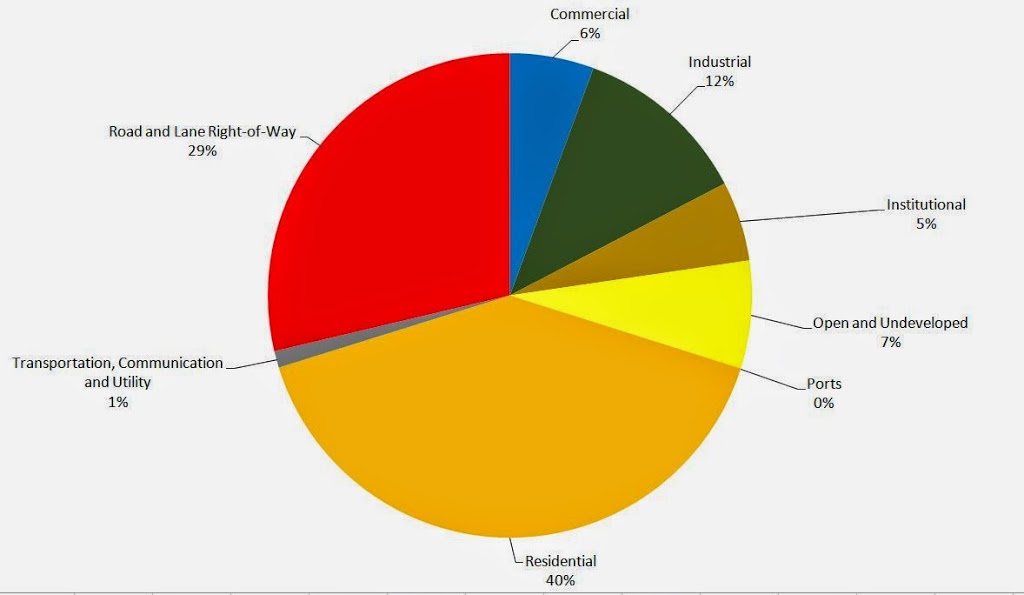 |
| Land use for “developable” land in New Westminster, 2006, by area. Click to Enlarge. |
Of the “developable” land in New Westminster, 29% is covered with asphalt so people can drive on it. If you include the City’s undevelopable Parks and Protected areas, that number only drops to 26.6% Both of these numbers are the highest in the region. Comparing our immediate neighbours: Burnaby is 17% road, Coquitlam 9%, and Surrey 11%.
OK, enough with the numbers, you say- what does it all mean?
Roads don’t pay taxes. Dedicating a large portion of your land space to roads means that land is not earning revenue for the City, so the taxes on the adjacent (commercial, industrial and residential) lands have to be proportionally higher to provide the same level of services to the residents and businesses of our community. However, it is worse than this, because roads are a huge financial burden on Municipalities. Pavement is expensive to install and maintain, as are the associated drainage works, curbs, road markings, signs, lights, overpasses, and other fixed assets that keep the road system operating. Add to this the less tangible policing, fire, and ambulance costs related to enforcement of traffic laws and dealing with accidents and injuries on the roads.
I’m not arguing against roads, they are a service the City provides, through your taxes, for the general good (dare I say, they are an example of a benefit of socialism). I am arguing that the City with the highest proportion of roads in the British Columbia should continue to resist the calls from neighbouring communities to solve their traffic problems by turning more of New Westminster into road space.
It isn’t just a matter of livability, it is also because we simply cannot afford to give more of our land away to support their poor planning.
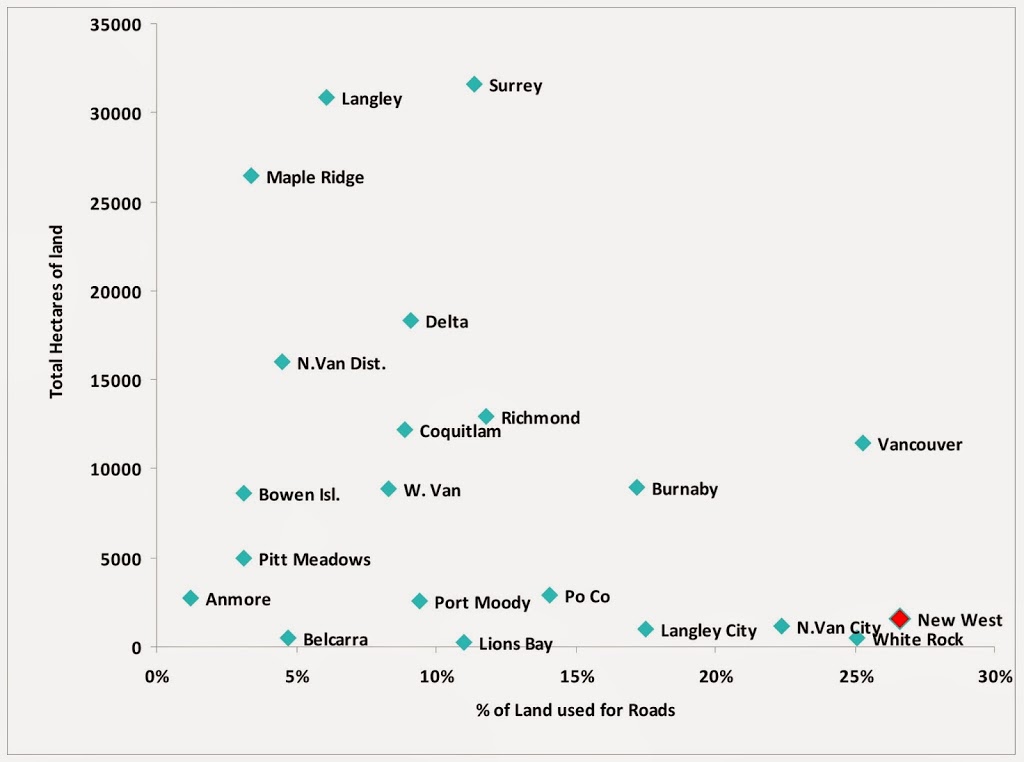
Bonus Graphing Excellence: Here is a plot of the Area of every Municipality in Metro Vancouver with the % of that area dedicated to roads. Note poor correlation between two data sets. You might need to click to make readable.
Another fine article and with whose conclusion I agree.
I must say, I was surprised that the proposition of New West under asphalt was so high. Intuitively (at least to my warped way of thinking), I would have thought that the less reliant on vehicular traffic a city/town is the less of its area needs to be under asphalt (New Westminster being in top 3 of adoption other modes of travel in Metro Vancouver). Perhaps the representative metric is square metres of asphalt per capita?
It would be interesting to see what the equivalent asphalt figure is for Manhattan.
Our land? As if new west is its own nation and those precentages are higher only because I would assume new west is smaller, if the nation of new west had bigger borders those precentages would drop. This lower mainlandisim of constricting people and closing off places is going backwards e.g. Vancouver and bike lane investing rather than say electric vehicals or public transport.
Assumptions are a problem. There are several smaller Municipalities with smaller percentages of their land paved, even fully urbanized ones like Langley City, North Van and White Rock. Just to test your theory, I plotted the total area vs. road percentage (see above), and the correlation is pretty weak. I couldn’t make a line fit any better than RSq. = 0.11, which is pretty close to random distribution.
That said, theories about *why* we have the highest percentage have little to do with what we do about it now. My point is that when our neighbours propose we add more roads, we have a legitimate reason to say no thank you.