Gordon Price has almost the opposite Blogging philosophy than me – he just puts direct, incisive, short messages out there, and provides enough links so you can put the pieces together yourself. I tend to draw things out laboriously and write with about 2,000 words what a brighter person could in 200.
Case in point- this post you are currently reading, which is a follow up to this post on Gordon’s blog “Price Tags”, where he provides two images, a quote from the source, a couple of links and says everything that has to be said in three short sentences. Contrast this with the long diatribe below.
Clearly, the Province Newspaper has the hate on for bicycles. I suspect it has less to do with bicycles and more to do with not particularly liking the current Mayor of Vancouver, whom they blame for the sudden appearance of bicycles and bike lanes in Vancouver. The fact that all these bicycles and bike lanes are appearing because of a Transportation Plan developed in the City of Vancouver in 1997, and moved forward by Mayors Philip Owen (NPA), Larry Campbell (COPE), Sam Sullivan (NPA) and Robertson (Vision), is missed in the current discussion, but I digress.
So I follow the links Gordon Price provided, did 5 minutes of Google research, and figured that the Province was indeed profoundly dishonest in their reporting on this issue. As is my wont, I went to twitter and called the Province on it. I might have used slightly stronger language than Mr. Price, but I clearly got a reaction, which led to this chain of communications:

Yeah, I’m a bit of a jerk, but I think they deserved it. Here’s why.
Start with the headline:
“Bike-lane ridership stalled on Burrard Bridge”
See, bike riding is increasing across the City, as is transit use and just plain old walking to work, while car use is the only mode of transportation in Vancouver that is on a steady decline. The Burrard Street Bridge bike lanes, as successful as they are, were the first time that the idea of dedicating a small percentage of the City’s asphalt to bikes hit the front page. It was, if you will, the first public battle in the imaginary “war on cars”. It also happens to be directly attached to the now-controversial Cornwall-York-Pt.Gray Road bike plan, which is the were the latest battle in the same imaginary war is being fought.
So what better story than a story about how no-one is biking over the Burrard Street Bridge anymore?
Too bad it isn’t true.
“Cherry Picking” is a common rhetorical technique where you take a big body of data, and selectively choose from that data the specific set that makes your point. The best example of this is with the current crop of Climate Change Deniers who say something like “It hasn’t gotten any hotter since 1998”– knowing full well that 1998 was the hottest year in history (well, not really, it is complicated), and ignoring the fact that every year after 1998 was warmer than almost every year before 1998. It is the easiest way to lie with statistics.
So look at the data set that the Province graphed for your benefit, and you see some months were ahead of others (likely related to week-long runs of bad weather that dissuade some riders, but maybe also related to road repairs, Canucks playoffs, whatever little bits of data go into the bigger noise:
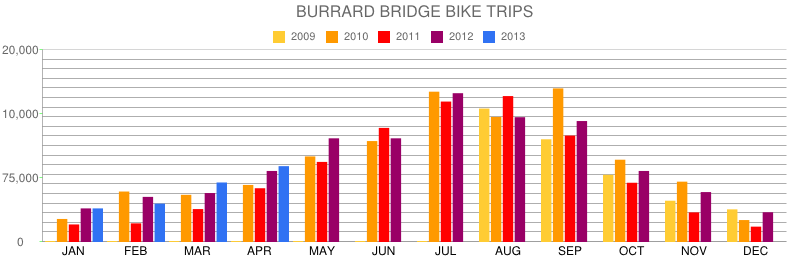
It is hard to take from that that data set that cycling is declining, or “stalling”. In this very first level analysis, from two specific time points, on one of the routes measured, there was a 1% reduction in counted cyclists on one route. The model for Cherry Picking data.
Being the detail-oriented guy I am, I went to the City of Vancouver website and tried to find the data source. The only thing I found was this site, which does actually report cycling traffic counts for the last few years on specific routes. I brought the .pdf file into Excel and created a chart as close as I could make to the Province one. This proved rather challenging, as their y-axis didn’t make sense- (75,000, 10,000, 20,000 !?!)- and clearly made the raw numbers of cyclists look smaller than they were. Anyway, I used the real numbers, and it looked like this:
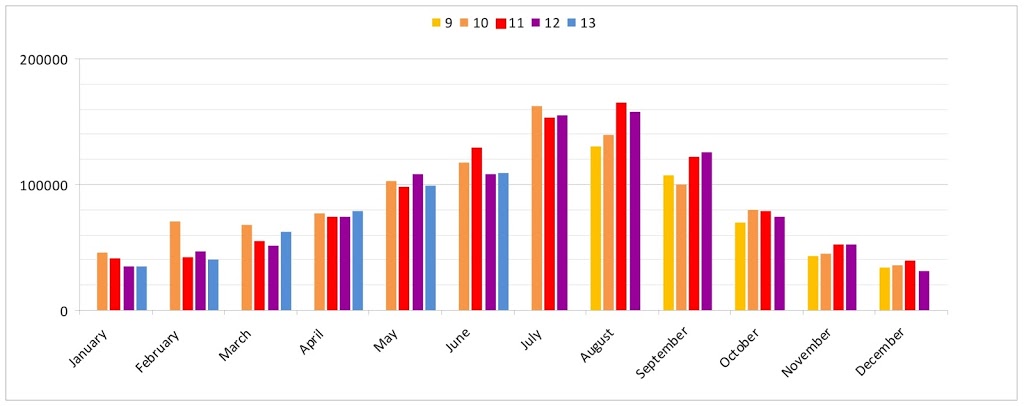
Which was subtly different from the numbers reported by the Province. Compare September, October, pretty much any month- the numbers they used are clearly not those from the City’s website.
So then I went to Twitter to ask Province what their data source was, and got no reply after 48 hours. What did happen was the Province, a few hours later, changed the chart that had in the online version of the story:
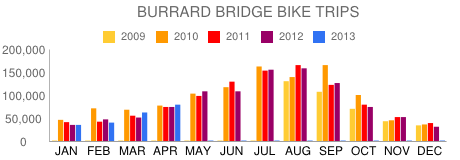
It looked a little more like mine in a few months (January and February), although some months still had bad data (see September). At least they had their y-axis figured out. Progress for the old media.
So let’s ignore their charts, perhaps a mistake was made by an unpaid intern – really, with the Province laying off all of their paid staff, these kinds of things will happen. Let’s look at the actual data.
If you look at the last 12 months for which data are available, there are 7 months when more cyclists used the Burrard than in the same month in the previous year. There were 5 months when there were fewer cyclists. In longer-tern trends, you can pull other things out: January, February and March 2010 were anomalously high – which is clearly an effect of the Olympic traffic disruptions, and not something you can hang a trend on. The June 2011 anomaly can likely be similarly linked to the Canucks Stanley Cup run. My point only that the data is noisy, making Cherry Picking a simple technique.
Looking at the raw data, it is clear that there have been something like 1 million bike trips cross the Burrard Bridge within any 12-month period in the last 4 years. Which makes one wonder how the Province ever found a situation where they could take a picture of the bridge and only have one cyclist in frame.
To quote the article:
“Despite years of Mayor Gregor Robertson and his Vision Vancouver councillors peddling the merits of pedalling, ridership on the controversial Burrard Bridge separated bike lanes has declined in the past year. Total bike trips compiled by the city for the 12 months ending April 2013 — the most recent statistics available — show that ridership is down by 16,000 compared to the previous 12-month period from May 2011 to April 2012.”
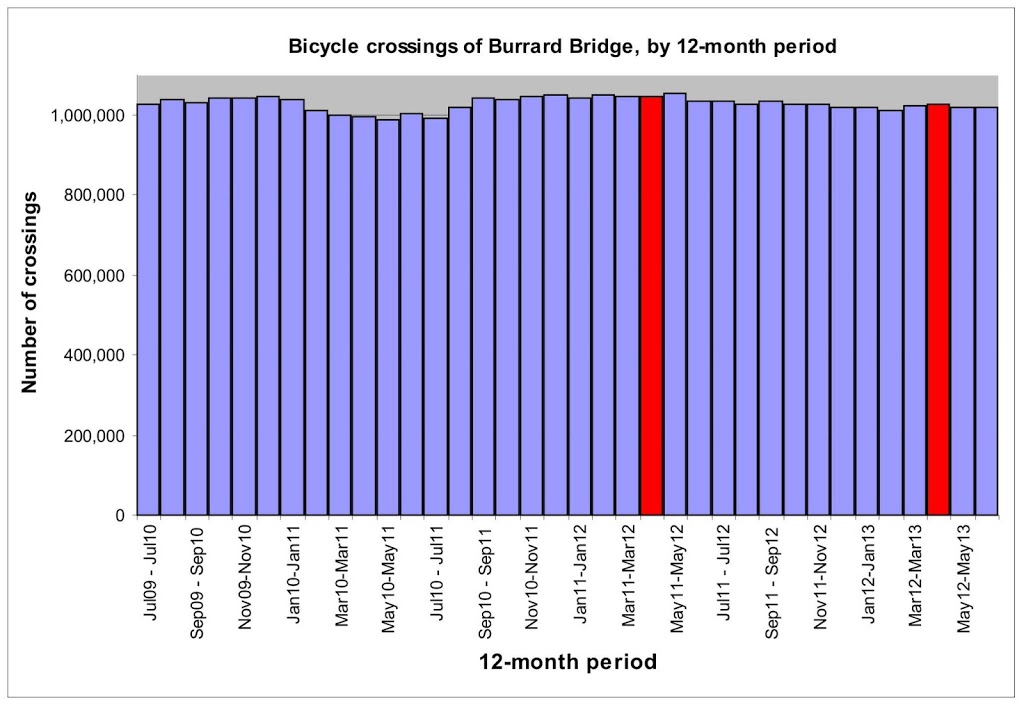
The data tells us May 2012-April 2013 saw 1,028,000 crossings where May 2011 to April 2012 saw 1,044,000 crossings. So the 16,000 reduction is true. But is it relevant? I took the 12-month cumulative ridership ending in every month from July 2012 to June 2013, and here is the trend (the two time periods mentioned in the Province story are highlighted in red):
Of course, they were also lying, depending on how one reads the statistics.
That Twitter exchange was a waste of everyone’s time – you didn’t say anything specific, so how could they say anything but what they did say?
And you’re doing *exactly* the same thing you’re accusing them of doing – translating “ridership stalls” into they said “no-one is biking” is a fundamentally dishonest misrepresentation on your part. They never said that – YOU said they said.
Worse, the graphs provided do actually show a stall in ridership. You do know that “stall” in this context means “not climbing anymore”, right? It doesn’t mean “down dramatically”.
Sloppy, sloppy writing and analysis.
Alas, my Twitter-storyboarding skills are sketchy, and I did not outline the entire conversation, only the parts I took an active part in. The string did point directly back at the Price Tags post, which did outline the original failures of their analysis, and the dishonesty of their angle on the story- from depicting a nearly-vacant Burrard bike lane, to cherry picking data points, to burying the data about an overall city-wide increase in bike traffic. Nor did they point to the data source, or do any parsing of the data. It was lazy, old-media past-prime journalism, where they started with a well-worn opinion and wrapped the new data around it, threw a few opinions in there and called it ”news”.
In contrast, I (with characteristically hammy fists and amateurish style)dove deeper into the data set, provided links to the actual data, tried to understand what (if anything) the trends actually mean. Perhaps the “stall” in Burrard Street bike traffic is because a large number of former Burrard Bridge users are now using the vastly improved Granville crossing (where traffic has increased). Early “peaky” data was likely related to one-off events (Olympics, Canucks run, etc). You know – the kind of journalistic analysis people might pay extra to read, and if the Province provided, may help their hemorrhaging readership problem.
As for my “fundamentally dishonest misrepresentation” of the message of the piece- go back to the piece and read the long comment string after it. It appears both bike lane advocates AND bike lane opponents read exactly the same message out of the story that I did, without my help. It was the Province writer who created that impression that was not supported by the data.
This is also why I provided a link to the 24hours story that used the exact same data, and came up with the exact opposite headline and story. And my slightly tongue-in-cheek final line.
Anyway, thanks for reading. Remember, when you come to my blog, you get the sloppy writing and analysis at less than half the price of the Vancouver Province’s sloppy writing and analysis!