I started posting about municipal taxes a few weeks ago. An astute #newwest hashtagger on Twitter, apparently finding me inadequately critical of local tax rates, suggested that once utilities were included, I would find New Westminsterites pay way more than nearly anyone.
“@NWimby Do a comparison with fees for sewer, water and garbage added to property tax and you’ll get a different answer.”
To which I suggested:
“@redacted go for it! Love to see you do that!”
To which the commenter retorted:
“@NWimby It has already been done. NW is 2nd highest behind Maple Ridge but NW is 6squ. Miles and Maple Ridge is 103squ. Mile”
Since no actual data was proffered, I decided to do the analysis myself. Luckily, I had a few hours in an airport with WiFi to do the digging through City websites. The results were interesting, for me at least. For the rest of you, come back next week, I’ll rant about skateboards or bridges or something.
Much like Mil rates, it is sometimes tough to compare between municipalities, as different jurisdictions handle their utility accounts differently. I did my best to compare apple to apples.
Water utility rates are difficult to compare because some cities have water meters for residential users, some don’t, and for some meters are optional. Even the metered cities usually have a flat service charge with a metered rate on top. So to compare the typical annual water bill, I assumed that the house used the average amount of water for metered Canadian households, which is 25 cubic metres per month.
Sewer rates are also sometimes tied to metered water use, and in that case I made the same assumption about typical water use volume. Some cities have extra “drainage” levies or charges to deal with storm water costs, some include it in their sewer bill. I have added all sewer and storm drainage charges, metered or not, into the singe sewerage charge.
Garbage and recycling was the hardest to compare, as every city offers different services. Some have organics collection, some blue box, some co-mingled recycling. Some charge a lot less for “small” containers and really ding the big container users, others have less difference. So for the purposes of comparison, I assumed everyone used a 120L trash, green waste (if available) and blue bin.
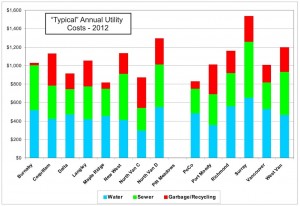
I did the best I could collecting all of this data together (and if you find a flaw, please let me know!) I found nothing on-line for Pitt Meadows, and didn’t care to dig too much further. I am suspicious of Burnaby numbers, but that doesn’t affect my analysis too much. This table shows the “typical” household utility bill, per year, for each municipality:
 |
| Click to enlarge |
Again, we see New Westminster is somewhere in the middle, 6th of the 14 municipalities for which I could find data. Our water rates are lower than most, our sewer rates higher than most, and our trash/recycling about typical.
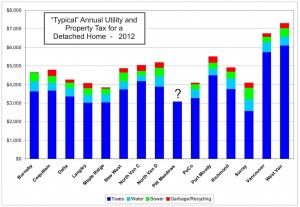
So what happens when we add this to the annual tax bill for the typical detached home? This is what happens:
 |
| click to enlarge |
New Westminster ends up right in the middle, 7th of 14 municipalities with utility data available.Maple Ridge isn’t the only Municipality more expensive than New West, as suggested by my Twitter friend – it is actually a relative bargain (except, of course, you are stuck in Maple Ridge).
FYI Patrick, even one of New Westminster’s own councilors admits New West mill rates are well above others. This is where the rubber hits the road….
“Harper said even though land values are relatively the same compared to Burnaby, Coquitlam, Richmond and Surrey, New Westminster’s mill rate was well above what they charged.”
http://www.newwestnewsleader.com/news/188113951.html
So the city cuts light indusrial rates but not property tax rates via the millrate. Why won’t people talk about the cost of running this city for 60K+ people, that might be interesting.
City Worker
My fellow Muni…
Not to speak for a Councillor, but reading that link, it is clear Harper was specifically talking about Light Industrial rates, which are calculated on a “multiplier” above residential rates. The report to council shows that New Westminster’s multiplier for Light Industrial is higher than the GVRD average, hence the desire to adjust it down to more like everyone else charges (or “to be competitive” in the parlance of the day).
The residential rate, when compared to home values, is already pretty close to average with the rest of the region, as I demonstrated in all three posts on the subject. If we are spending too much running this City, so is every other City.