Just a little more fodder for the Pattullo discussions.
We all know the Pattullo is a dangerous bridge: it is narrow, the road curves, the merges and approaches are unsafe. It is anthropomorphised as some sort of “killer” bridge, and few feel safe driving across it. But is it actually unsafe?
The problem with common knowledge is that it is rarely either.
Surely there was a spate of terrible head-on accidents on the bridge a few years ago, and we all remember them well. However, the last head-on fatality was in 2007, they have dropped remarkably since the late-night centre lane closures started. 26 fatalities between 1996 and 2006 are too many, we can all agree, but the count since 2007 of zero is pretty much what we have been looking for. The measures in place seem to be helping, and more important to the current discussion, the main cause of these crashes isn’t narrowness of lanes or lack of central median.
The story from the 2006 tragedy indicates ICBC found 85% of people crossing the bridge were driving more than 30km/h over the posted limits. Not a few or some people exceeding the limit, but almost everyone, and not exceeding the limit by a few km/h, but by more than 75% of the speed limit – with a large number of drivers exceeding the definition of “Excessive Speed”, you would think that a couple of Photo Radar cameras would do more for the safety of this bridge than any other measure. But I guess that ship has left the dock…
Regardless, if people feel unsafe on the bridge, they are sure not displaying it by behaviour: in a rational world, people usually slow down on dangerous roads, they don’t drive at excessive speed.
At their Open Houses, TransLink commonly repeated the statistic of 138 crashes per year (one every three days), and 33 crashes causing injury per year. That sounds bad, but is it?
Perhaps a useful comparison is to the other major bridge that TransLink operates, and for which we have significant statistics: the Knight Street. I asked ICBC for the crash statistics for the two bridges over the last decade, and here is what they sent me:
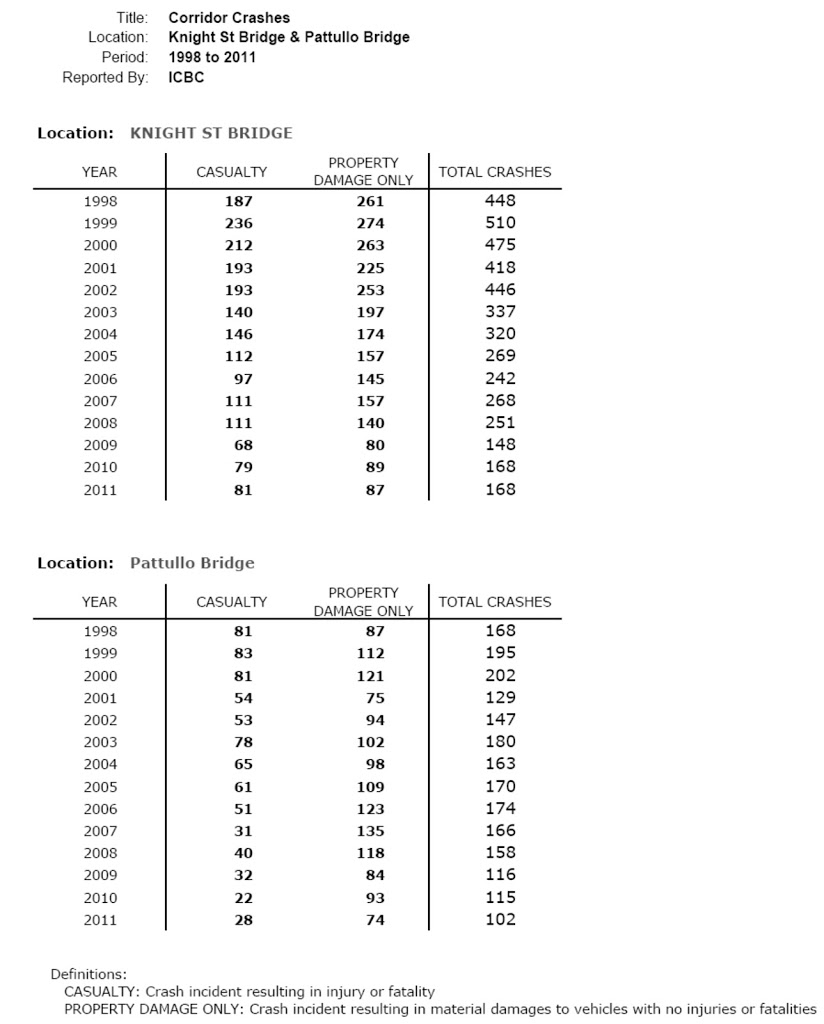
Here is what it looks like graphically.
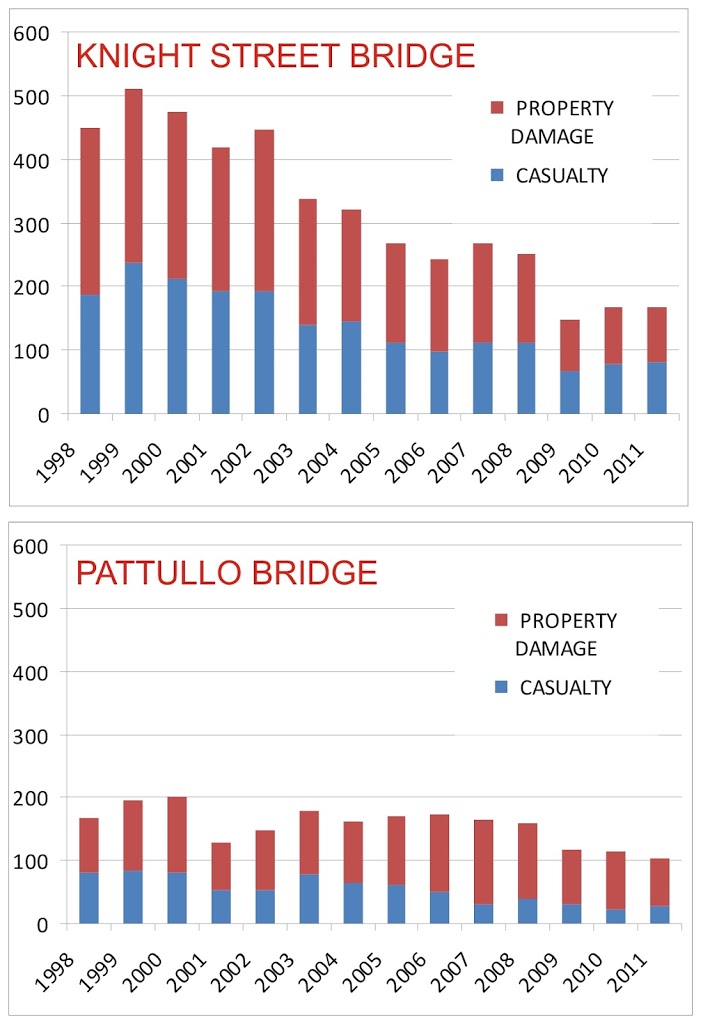
The blue columns are “casualty” data, those crashes where there is a reported injury, which could be anything from a fatality to serious trauma to whiplash (note these are counts of crashes, not of injuries). Stacked on these are the red columns of accidents where there was no ICBC injury claim.
So TransLink’s number of accidents, 138 per year, is a fair estimate of the average over the last 6 years, essentially since the barriers went in at night, but does not acknowledge the significant decrease in accidents over the last three years. The number of accidents with injuries has also been decreasing markedly.
What is shocking is how the Pattullo has always been a significantly safer bridge than the Knight Street. In many years, there are more casualty accidents on the Knight Street than accidents of all kinds on the Pattullo, and the total for the Knight is often twice that of the Pattullo. There has been a similar decrease in accidents over the last decade on the Knight Street Bridge, and that has closed tha gap a bit, but the comparison is shocking. Especially when you look at the Knight Street Bridge:
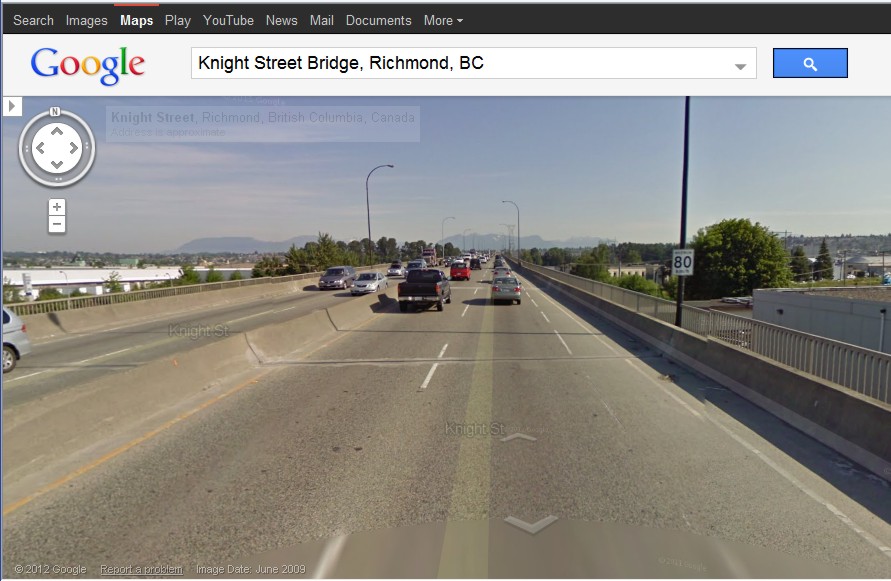
Knight Street is straight; it has wider lanes, a central barrier, and a shoulder for buffer room. It is predominantly a 4-lane bridge, but has two extra outside lanes on the short northern part of the span connecting the Industrial area of Mitchell Island to the Marine Drive truck route (ostensibly “truck priority lanes”). Why is it so much more dangerous than the “Killer” Pattullo Bridge? Why are we not investing in making the Knight Street safer?
Or maybe more important: why are we so afraid of the Pattullo Bridge?
ICBC gave me permission to share the above statistics, but asked that I include this caveat with the statistics they provided: