If you missed the first open house for the Master Transportation Plan, or would like to arm yourself before the St. Valentines Day Messaging, the presentation materials are available on-line at the City Web Site, which provides me the opportunity to go on about some of the details therein. I am completely copying these graphics here without permission form the City, so I suggest only New Wesmtinster taxpayers, who paid for them, should click on them to see full-size versions. 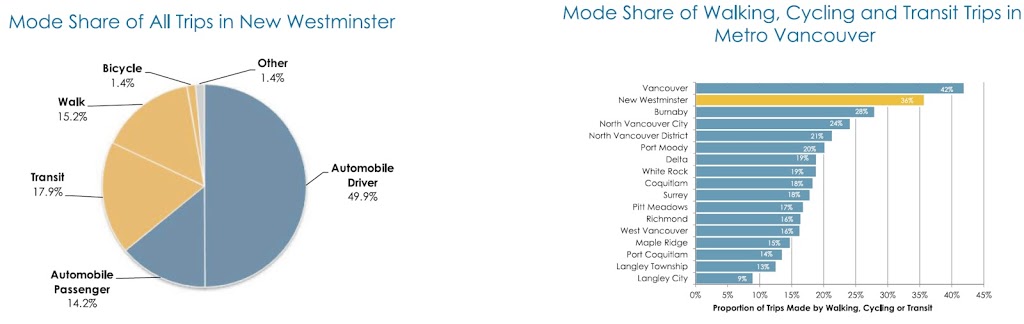
The fifth slide (above) provides the first really interesting data. The bar chart shows Metro Vancouver municipalities ranked by “mode share”. That is the proportion of “trips” taken by modes of transportation other than driving a car. It is pretty clear from this bar chart that New Westminster is already a regional leader in sustainable transportation, with a mode share of 36%, second only to those dirty bike-lane hugging hippies in the City of Vancouver.
What I take out of that chart, though, is a demonstration that infrastructure matters. The top three Cities are those with the complete integration of the SkyTrain. The next two are also well serviced with transit, with the SeaBus an important part of their infrastructure. All of the top 5 have put serious investment into bike lanes and pedestrian amenities. They have all put an emphasis on building compact transit and pedestrian friendly town centers.
Now scan down to the bottom of that list, and see lowly old Langley City. Aside from its abysmal transportation infrastructure and complete commitment to automobiles, Langley City has no excuse for this. It is compact with relatively high population density (2,500 per sq. km., compared to New Westminster’s 3,700 and Burnaby’s 2,200, which are all way higher than North Vancouver District or Langley Township, which are both under 500). It is relatively flat with a good balance of industrial, commercial and residential land. This 9% is no surprise, however, to anyone who has tried to traverse Langley City. No cycling facilities at all, disconnected and disregarded sidewalks, a half mile of parking lots separating every business. About the only infrastructure it has is a Bypass Highway and the Big Box Hell that is 200th Street. As a cycling buddy of mine once said, reading a road sign: “Langley Bypass. I don’t care where you are going, that sounds like the right idea.”
What’s worse: the Mayor of Langley City, Peter Fassbender, is the vice-chair of TansLink’s Mayors Council. I’m not sure if the 9% should be more embarrassing for him, or if TransLink should be more embarrassed that he has been elevated to help lead the region in Transportation when his own City serves as cautionary example for the whole region… but as usual, I digress.
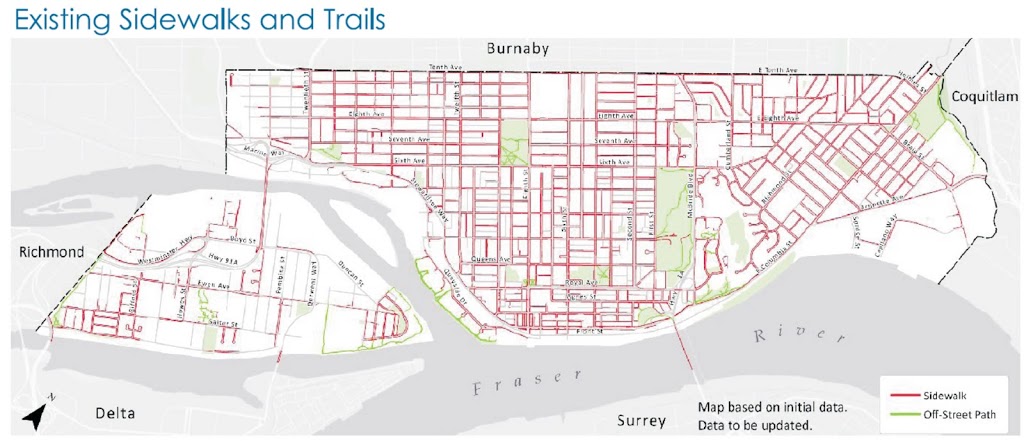
The walking numbers are not surprising. New Westminster is a great City for walking, and the hills are less of a barrier than some people (Such as the Downtown BIA) suggest, as long as the sidewalk infrastructure is there to make the walking environment pleasant. The map shows that Connaught Heights and Queensborough lag behind as far as walking infrastructure go. The “missing link” between Point Royal and The Quayside really stands out though…
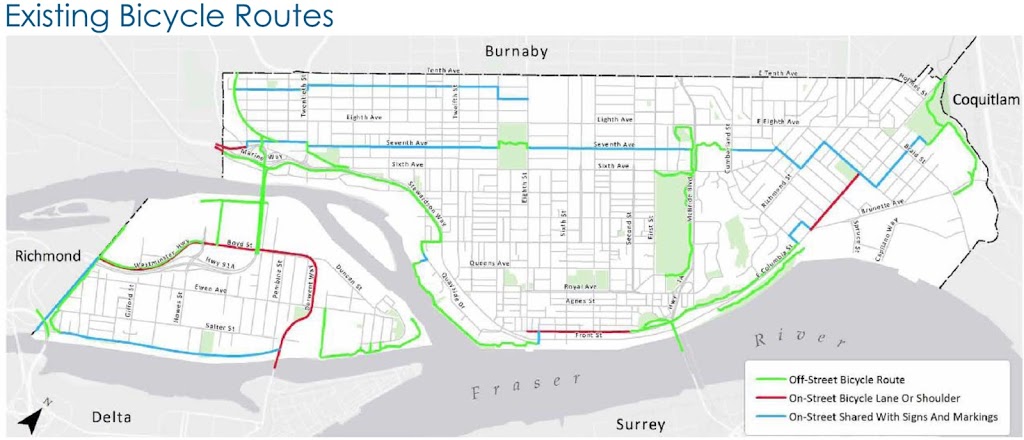
The bicycling infrastructure info is actually a little disappointing. The cycling mode numbers are lower than I would expect, and the cycling network is distressingly incomplete, 13 years after the cycling plan for the City was laid out. Even the designated bike routes we have are either suffering from erosion from disregard (BC Parkway anyone?), or are bike routes in name only, being just as unfriendly for cyclists and completely unmarked as they were 20 years ago (try to cross 20th street on the London Bikeway, I dare you).
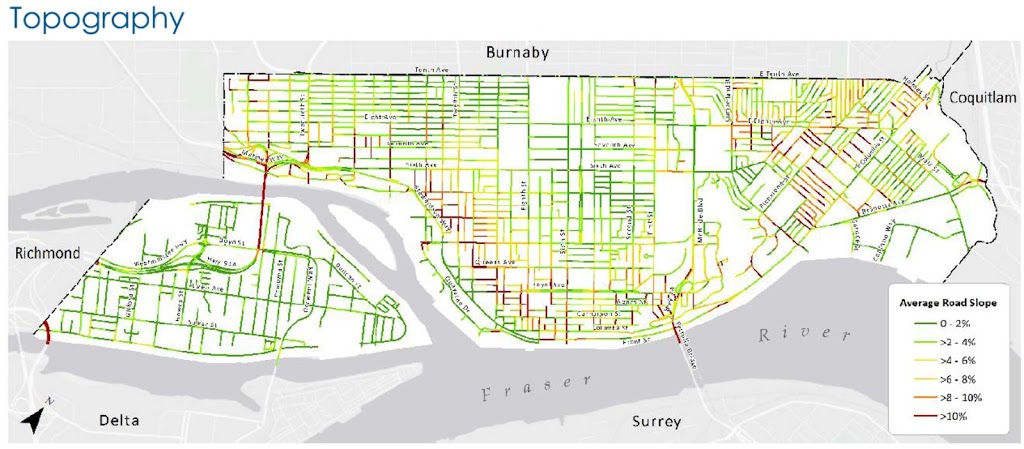
I love the topography map they have on the 10th slide. Whoever thought of that map must be a genius. It shows that most of New Westminster is not really that hilly. There are only a few areas where the slopes cause a real challenge to recreational or casual cyclists – the Downtown-Uptown link, the Brow of the Hill, and Sapperton. I hope with this Master Transportation Plan, we can re-draw the cycling map with this in mind, and find creative routes to make these slopes manageable for more cyclists. The City’s Bicycle and Pedestrian Advisory Committee already identified a route from New Westminster Station to the Saint Mary’s site that connects relatively gentle slopes with very short stretches of higher grades, with only a few missing links that need to be connected. The advantage of the current low mode share is that it should be easy to increase in the foreseeable future.
Transit is a good news story for New Westminster, and a large reason why we have such impressive mode share numbers. As I said before: infrastructure matters. Five SkyTrain stations for 60,000 people is one of the remarkable advantages of being a compact City in the centre of Metro Vancouver.
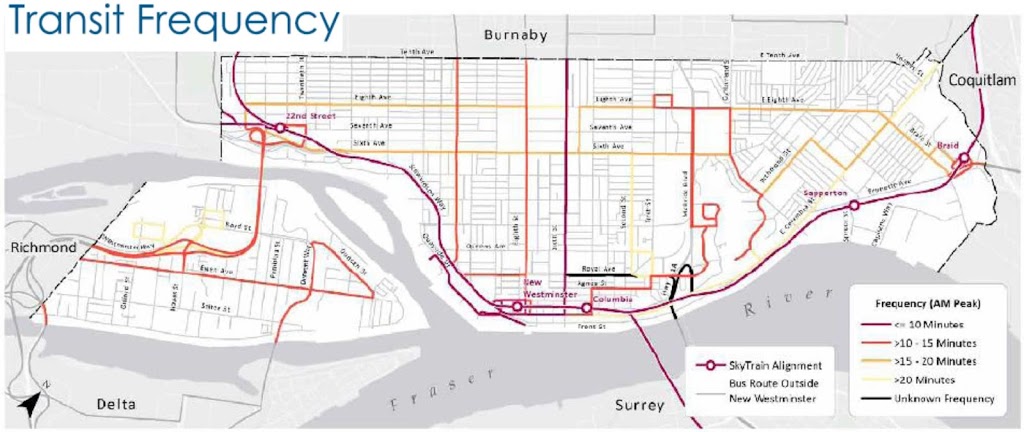
The problem comes down to frequency. The diagram above shows AM peak time frequency, which is pretty good. However, the City’s largest employers are not 9-to-5 mom-and-pop operations, but have a lot of shift workers. We also have a large lower-income population (due in part to our large rental property stock) who tend to also work in less traditional jobs. The reality for many people in New Westminster is that much travel for work is during off-peak times, not to mention travel for play. When transit service drops to 30-minute, or 60-minute service, it becomes completely unreliable. Especially in a place like Queensborough, where 20 minute bus service for a 15-minute ride to 22nd Street mean that it can take more than half hour at the best of times just to get to the SkyTrain Station you can see over there on the Hill. Once we hit 11:00pm, much of the transit frequency drops to zero.
Of course, this is slightly out of the scope of the City’s jurisdiction. there is little the City can do but lobby TransLink to improve service. Unfortunately, we have been going the other way of late. What the City can do, however, is make sure the infrastructure on the ground is there to make using transit easier. For example, the City, as a general rule, lacks bus shelters. There are also several decisions we can make to prioritize cycling and pedestrian infrastructure improvements at vital transit links. Finally, we can (outside of the Master Transportation Plan, mind you), continue to encourage dense land use at our major transit nodes, like we have done at New Westminster Station and Sapperton Station, and are looking at for Braid Station. How long can 22nd Station be surrounded by single-family homes?
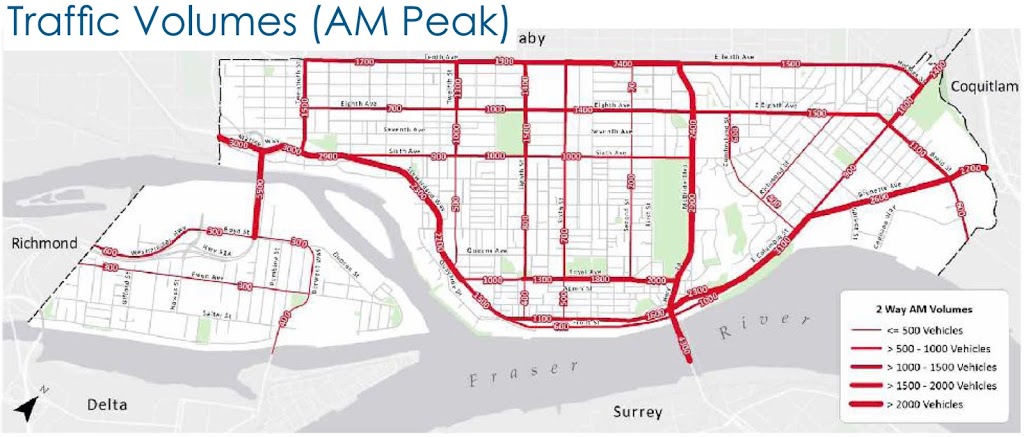
Slide 16 was interesting for a few reasons. The numbers that really stood out for me were 4,300 vehicles per hour on the 4-lane Pattullo Bridge compared to 3,500 on the 4-lane Queensborough. Who would have thought the lil’ old Queensborough carried more than 80% of the traffic of the big bad Pattullo? But I also don’t understand how we can have 3,000 vehicles on both sides of the bridge, and 3,500 over it… there is something funny about where these numbers were collected and what they mean for that intersection. I suspect this also argues pretty strongly towards saving a ton of money and and replacing the Pattullo with a 4-lane structure, but another post, another time.
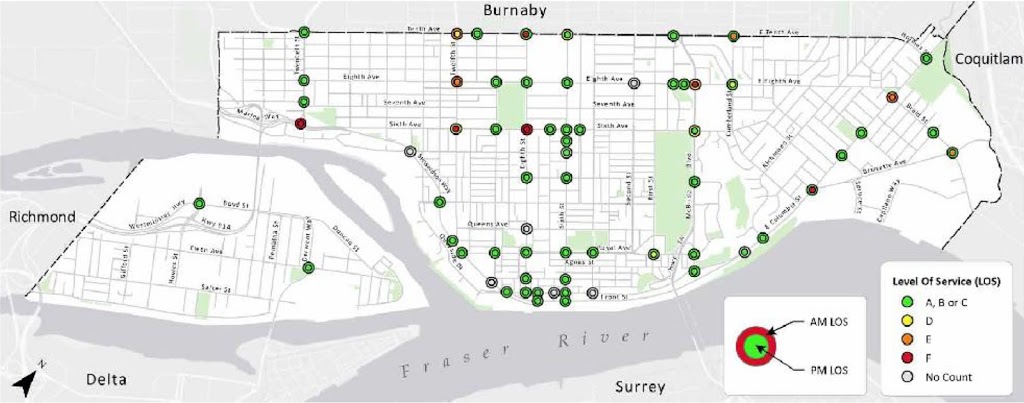
It was also interesting to see how the intersections we all love to have performed when measured by actual delay relative to their design traffic volume. The stand-out is that the intersections on 20th perform fine. This is a surprise to those backed up on 20th, or the people of Connaught Heights and the West End who can’t get out of their neighborhoods due to the gridlock on 20th. this also reflects a recent traffic study on 20th done for the City by another consultant. Long and short: the problem is the Queensborough Bridge. There is nothing we can do to improve 20th street except re-write the Queensborough Bridge interchange, which is Provincial jurisdiction and has already had a large pile of cash concerted to concrete in recent years. I think the best approach here is to re-design the traffic system on 20th to make it most useable by Connaught Heights and West End Residents, and let the through-traffic back up into Burnaby. It may be a simple as redesigning the traffic light signals…
The good movement info here is the one that has so far generated he most discussion. The City’s survey has reflected what TransLink has said all along: about 40% of New Westminster Truck traffic either starts or stops its trip in New Westminster. A few people (including Councillor Chuck Puckmayr at last week’s Committee of the Whole meeting), have questioned the methodology that resulting in the is number. I am more interested in where in the City these stops are happening – are they all going to Kruger? Are they driving across the Pattullo and through downtown on the way to Queensborough landing? Just how many semi-trailers full of food does Safeway need in a week? I really don’t know. But that kind of data might be useful.
The other part of the goods movement discussion is already popping up in the local media, and that is the future of truck traffic on Royal Ave. I think the issue of directing all commercial traffic to Royal is a big one, especially as we are going to have another school built right on it. There is strong pressure right now to make Royal the truck route, which will effectively increase total truck flow through the City. I think that is a bad idea, for various reasons. But again, this is already too long a post, so I will address that another time.