ASK PAT: Housing idea

Terran asks—

What do you think about the recent Vancouver idea to buy homes and undervalue them? Do you think this could work in new west? http://www.cbc.ca/news/canada/british-columbia/city-of-vancouver-affordable-home-ownership-pilot-program-1.3539688

I can’t quite get my head around the City of Vancouver plan. They appear to wan to buy 20% of the housing value, and hold that portion while the market still influences the pricing of the units. If I understand it right, a middle-income-family would by 80% of a home, live in it, sell it off and receive 80% of the sale price. If the value goes up (as is likely today) when they choose to upgrade or move to Temiskaming, do they get 80% of the capital gain and the City the 20%? There are devils in details here.

My first question when putting this in the New West context would be –is it legal? Vancouver seems to be floating the idea of making changes to the Vancouver Charter to make it work, and I’m not sure how this model would fit into the Community Charter that governs New West.

There is another simple resource problem: New Westminster does not have a lot of money. We don’t really have a longer-term land acquisition strategy to speak of (we are working on developing one now), nor do we hold a lot of property relative to many of our surrounding communities. Investments that could have (should have?) been made decades ago when land values were low were not done for what I’m sure were very practical reasons at the time. Our finances are pretty good, but the few capital projects we have coming along in the next few years (Massey Theatre, Q2Q, Canada Games Pool, etc.) are going to tighten things up quite a bit.

This raises the question if this is the most effective way to leverage the money we do have. The City holds about $1Million in our Affordable Housing Reserve, and we have a task force working on a couple of strategies to leverage partnerships to assure those funds go to where they can make the best impact.

Finally, I wonder if the Vancouver solution (making apartments 20% more affordable for essentially middle-income workers) is really the affordability problem we need to solve in New West. I get the sense that New West is affordable for middle-income earners, especially if they are happy to live in an apartment setting. Single Family homes are getting out of reach, but building more “missing middle” housing types like townhouses, laneway houses and cluster homes might help provide better options to those earning family incomes in the $70-90,000/yr range (the target of Vancouver’s plan).

In New West, we are seeing creeping land costs and a paucity of rental availability that is putting a lot of stress on the lower-income cohort of our population. As the working middle are pushed to New West, they are displacing the working poor and underemployed who need affordable housing within transit or walking distance from their jobs, their schools, and their support systems.

Unfortunately, this situation is getting worse at the same time that the largest community network of affordable family homes – Co-op Housing – is going through an existential crisis caused by the federal government cutting off support, and the provincial government failing to fill the gap (as is their constitutional role).
In the meantime, New West is doing what it can to get both market and non-market rental built as soon as possible, and to develop a new Official Community Plan that emphasises diversity of housing choice. Meanwhile, the Mayor has an Affordable Housing Task Force that is working on the best potential use of the affordable housing reserves, and the Mayor himself is working with the Metro Vancouver Housing Board to develop regional affordability strategies.

Not that I am disparaging of Vancouver’s idea. In this strangely super-heated market, coupled by a booming economy where everything but wages are going through the roof, we are going to need a variety of strategies to keep our region livable. Housing is a symptom of a larger economic malaise that points back to decades of neo-liberal economic “progress” where the building of wealth is prioritized over the building of society. But that is a talk for another day.

ASK PAT: Front Street trucks.

Brad asks—

During Front Street’s closure over the past couple of months, trucks have been re-routed to Columbia and Royal. This doesn’t seem to have had that bad of an affect on New Westminster’s traffic (at least, to my eye), so what are the thoughts about banning truck traffic from Front Street entirely? Can this be visited when the Pattullo Bridge gets replaced? Front Street isn’t part of TransLink’s Major Road Network, so we shouldn’t have to ask them, right?

Although I agree the “Carmageddon” promised by Front Street closing has not arrived, there has been a shifting of trucks to Columbia Street, and anecdotal increases in trucks on Royal and 10th Ave. The City is collecting data on the traffic during the closure in order to get good numbers on the shift, and that report is not available yet, but preliminary info seems to suggest about a 30% increase in trucks on Royal. There has also been a diversion of trucks to Columbia and 10th Ave, but these three increases do not add up to the number of rucks that used to ply Front Street. It is pretty clear that a large proportion of the tucks that were on Front Street have, indeed, gone away. Presumably most of them have gone to the $5 Billion of freeways we have built for them over the last decade, as the Lord Kevin Falcon intended.

Front Street is not in the Major Road Network, but it is a designated truck route. To change that, we need agreement from the Ministry of Transportation and at least consult with TransLink. The current policy is that trucks routes cannot be removed unless appropriate alternatives are offered. So if closing Front Street to trucks means we need to allow 24/7 access to Columbia Street, then it is probably not a good deal for the City.

Capture2

If the closing of that route means accepting a measured increase in Royal Ave and 10th Ave, then perhaps it is a discussion we should be having as a City. However, to have that discussion, we need some solid numbers to support the cost-benefit, and those numbers are being collected. Of course, this ends up being a political discussion – the people who live on Royal are not going to like it, and it will do nothing to make people feel better about the Qayqayt school transportation situation.

Offsetting these reasons to avoid the discussion, people need to go down to the Front Street right now and look around. I think we can, for just a moment now, have a vision of what could be. I’m not even talking about removing trucks from Front Street, I’m thinking we should explore the possibility of closing Front Street to all but local traffic. Build the Mews, turn the rest into greenway, parkland, open space for any of a thousand public uses we have not yet imagined. I don’t want to close Front Street to traffic, I want to open it for the use of human beings who aren’t dragging tonnes of internally-combusting metal around with them. There is a huge amount of space there, let’s start to dream.front

The primary argument for keeping trucks in Front Street is, of course, “Goods Movement”. The Gateway Council, the Port, the BC Trucking Association, and the Ministry of Transportation make the argument that the regional economy relies on free-flow of trucks along Front – this route is critical. This assertion will not likely be supported by any measureable dip in the regional economy caused by this 6-months closure. But don’t bring facts into this discussion.

Fitting the use of Front Street into the context of the larger Pattullo replacement strategy is important, as is fitting it into the model for the Brunette overpass replacement, which is an ongoing discussion between Coquitlam, New Westminster, and the Ministry. There are well-connected regional voices continuing to reiterate that New Westminster is a through-route, not a community, and are planning with this in mind.

Even as New Westminster aggressively pursues a smart growth strategy reflecting the Regional Growth Strategy; even as we push towards building a compact, mixed-use, transit-oriented community where most commuting and shopping trips are by foot or transit, reducing the need for expanded road capacity; even as we take a leadership role the region in meeting the mode shift goals of the long-term regional transportation vision, those very goals are challenged by our tacit acceptance that our community must play second fiddle to the commuting needs of outlying regions.

We have been leaders in planning and development to reduce our reliance on the traditional transportation models, we are becoming leaders in our transportation policy, but to see the benefit of those changes here at home, we may need to stop leading by example, and start forcing our neighbour’s hands.

Does the region need trucks on Front Street? No. Is there a better way to make use of that 5 acres of public space in New Westminster? Yes.

The rest is politics.

Sowing Doubt

The Earth is currently warming at a rate unprecedented in recent history, almost entirely due to human activity, primarily the digging up and burning of fossil carbon and introducing CO2 to the atmosphere at a rate much faster than natural biosystems can remove it. This is not a controversial set of facts.

However, much like people who refuse to believe that natural selection shaped the evolution of life on our planet, or those that believe there could be a breeding population of large bipedal hominids lurking just out of sight in the woods of the Pacific Northwest, there are some for which this set of facts cannot fit within their political, religious, or economic ideologies. No problem, it’s a big world, reality isn’t for everyone.

Problems do arise, however, when those so separated from reality are given the power to shape public opinion and political will. I provide for your review the most recent opinion of Black Press’ go-to climate change correspondent, Tom Fletcher. I recognize the Streisand Effect of even calling attention to this bunk, but perhaps we can glean from this a teaching moment.

There is a lot in here, representative of Tom’s liberal (ahem) application of the Gish Gallop on this topic, so I will only pull out two major themes, where he brushes up against the science. I’ll touch more on the politics later.

“According to the environment ministry’s 2015 Indicators of Climate Change report, B.C.’s average temperature has increased about 1.5 degrees from 1900 to 2013, slightly more in the north and less in the south. That’s one one hundredth of a degree per year”

See how only little cherry-picked factoid stripped of context can be used to sow doubt about the seriousness of the situation? The report (which you can read here) says 1.4°C per century from 1900 to 2013 (doing the math on that strange bit of language, that means 1.6°C in the 113 years between the two dates). At the risk of pedantry, this is 40% more than one one hundredth of a degree per year – an annual change of 0.014°C.

Still, a number so small, it can’t possibly a problem, right? Except…

We can all agree the climate has changed before. During an era 10-20,000 years ago there was a dramatic climatic change that saw continental glaciation in North America come to an end. What is now British Columbia went from being about 95% covered with ice to less than 1%. No doubt this type of dramatic climate shift had devastating effects on the extant biosystems, not to mention any society that existed during that time. Some survived, others didn’t. It was monumentally disruptive.

However, that dramatic landscape-shifting shift in climate came with a 3.5°C shift in temperatures over about 8,000 years. To simplify this trend to Tom Fletcher math, that is about 4 ten-thousandths of a degree per year – an annual change of 0.0004°C. The current temperature shift is happening at more than 30 times the speed of the previous, devastating one.

Except it isn’t, because the current trend has been accelerating over those 113 years. The rate of warming now is more than twice that of the first half of the century. If one looks only at the trend from 1960 onwards (as the ubiquitous use of fossil fuels and resultant exponential increase in energy consumption has expanded from the socio-economic “First World” to the majority of the planet), the rate is not only faster, but the acceleration is accelerating.

“The B.C. report ritually attributes this to human-generated carbon dioxide, the only factor the UN climate bureaucracy recognizes. And here lies a key problem for the global warming industry.

“More than 90 per cent of the greenhouse effect in the Earth’s atmosphere is from water vapour. Antarctic ice core analysis shows that over 400,000 years, increasing carbon dioxide has lagged centuries behind temperature increase. This suggests that rising temperatures lead to increased CO2, not the other way around. (Scientific American, working hard to debunk this, found a study that shows the CO2 lag is only 200 years, rather than 800 as others calculate. Still, it can’t be causing warming.)”

A little knowledge is a dangerous thing, and the measure of Fletcher’s knowledge of this topic is most generously described as “little”. So let’s unpack that paragraph a bit and see where his failure to do his reading has failed his keenly skeptical mind.

On water vapour, Mr. Fletcher is almost right. Water vapour is indeed a strong greenhouse gas, however the behaviour or water in the atmosphere (where it enters as a vapour, exists in all three phases at a wide variety of temperatures, and exits primarily as a liquid, influencing upward and downward energy fluxes at all times) is horribly complicated. The best estimates modelling these fluxes (and I’ll refer to Kiehl and Trenberth, 1997 here) suggest water vapour represents about 60% of the total radiative forcing under clear skies, and somewhat more under cloudy skies (at any given time, the planetary cloud cover is about 62% – a pretty cool factoid to pull out at your next dinner party). There are more complications here, as we can get into debates about defining the “greenhouse effect” relative to the impact on the planet’s surface vs. that in the atmosphere, about difficulty defining latent heat fluxes from precipitation, and other details that were definitely discussed in my upper-level boundary layer climatology courses, but that was 20 (ack!) years ago, and I am not as well versed as I once might have been.

Those caveats aside, the inference by Mr. Fletcher is that water vapour is a higher percentage than CO2, and therefore CO2 doesn’t matter. Nothing could be farther than the truth.

The same estimates put CO2 forcing at around 26%, based on historic CO2 concentrations (the 1990 concentration of 353ppmv was used, although the global concentration in 2015 is at least 13% higher than this). More importantly, one needs to recognize that the two gasses exist in the atmosphere in very, very different ways.

When we emit CO2 into the atmosphere, it essentially stays there until sorbed into the ocean or is made into rock through biogenic systems  – two very slow processes. Respiration by plants is, at best, a temporary storage, as the majority of CO2 that enters plants is returned to the atmosphere within a year or a decade, and almost all of the rest within a century. Stick extra CO2 in the atmosphere, it stays there for a long time.

Conversely, the concentration of H2O in the atmosphere is controlled by atmospheric pressure and temperature – because in normal atmospheric conditions H2O exists in all three phases (CO2 only exists as a gas in the atmosphere of earth- there are no conditions here where liquid or solid CO2 form naturally). Stick more H2O in the atmosphere, and it exits again almost immediately as rain or snow when the saturation level of the air at that temperature and pressure is met. If we double or treble human inputs of H2O into the atmosphere without changing atmospheric temperature, the net concentration of H2O in the atmosphere a decade later will be unchanged (notwithstanding the sheer enormity of the natural H2O cycle of evaporation and precipitation, where the most generous estimates of human inputs account for something like 0.005%).

So the only thing we can do to influence that 60% of forcing is to increase the temperature of the atmosphere (as meaningfully changing the pressure of the atmosphere, globally, is beyond our current terraforming technology). In contrast, by effectively doubling the concentration of CO2 in the atmosphere, we are wreaking havoc with that 26% of forcing – it is going up. And that’s the part we are talking about.

Now, onto ice those pesky ice cores. Those pre-industrial atmospheric CO2 changes over the last 400,000 years did lag behind temperature increases (by how much is a debated point, see Caillon et al, 2003). That should actually frighten us, not make us confident. It also in no way refutes the observation that anthropogenic combustion of fossil carbon is the primary driving force for the current temperature increases.

When the ice in those cores was being deposited (and ice cores are not the only temperature/CO2 proxies we have, but let’s keep this simple) it was recording long-scale shifts in global climate caused by Milankovitch cycles. Short version: cyclic wobbles in the axis of the earth’s rotation relative to the sun along with changes in the shape of our orbit give rise to 100,000-year long cycles of increased and reduced solar input. These shifts continue today, indeed we are just past a “peak” that occurred ~10,000 years ago, and are in the downward part of the cycle with solar input slowly decreasing right now. Global CO2 levels also shift in lockstep (or slightly after) these cycles, from 180ppm to 290ppm.

I cannot emphasize this enough – the historic climate effects of Milankovitch cycles occur at a rate orders of magnitude slower than what we are currently observing: Heating at a scale of 0.0005°C per year, cooling at a rate of 0.0001°C per year.

These historic shifts in temperature were not caused by changes in greenhouse gasses, and no-one has suggested they are. They are caused by shifts in the solar energy hitting the earth. So the cause of the much slower heating and cooling cycles recorded in the ice cores is not, in any practical way, related to the cause of the much faster heating today. They are two separate phenomena, operating in different ways, at different scales. To compare them is like comparing the tide coming in to a tsunami – both cause the sea to rise, but in different ways, through different processes with, different effects.

So Fletcher is right- the initial cause of warming 25,000 years ago, 130,000 years ago, 250,000 years ago, was not CO2, but that does not mean the cause of the present warming isn’t CO2. In fact, we know it is.

More problematically, the ice cores demonstrate that increases in temperature related to outside causes can (and do) result in increased atmospheric CO2, for a bunch of reasons relating to carbon storage in soils and the sea. This, in turn, creates a positive feedback loop. As the earth gets warmer, more greenhouse gasses (GHG) are released, and that increased GHG concentration warms the earth further. This is the primary reason why the cooling phase related to Milankovitch cycles operates at a quarter of the speed of the heating phase – once that GHG blanket is thrown over the warm earth, it takes much longer to cool off.

That should scare us, as should the other data from the ice cores. Even at the “peak” of the previous cycles observed in the ice cores, planetary CO2 was only 290ppm. We are now over 400ppm, and the trend is continuing up. It also means that once those GHG hit the atmosphere, their effects are long-lasting, and getting back to start gets much harder the further we move away from what I can only loosely call a “baseline”.

In the end, the reality of this information doesn’t matter. No amount of science-based explanation is going to change Mr. Fletcher’s mind about this topic. He will continue to believe that the hundreds of thousands of scientists at NASA, NOAA, the American Geophysical Union, the American Meteorological Society, the Royal Society, the U.S. National Academy of Science, (and every other national academy of science on earth, from Bolivia to Zimbabwe), are either pulling a monumentally complicated con only he and a few of his buddies can see through, or are fools lacking his brilliant insight into global climate systems.

His views are so separated from reality that he may as well be casting Bigfoot footprints, and should be treated as a crackpot. Instead, he is paid for his misinformed opinion, which is subsequently circulated widely throughout BC, as the lead columnist for the only newspaper that much of BC ever sees: their local Black Press iteration resulting from our era of old media consolidation.

Although the facts of anthropogenic global warming are strictly scientific, discussing these facts is unfortunately political, because the implications and any solutions to address them will require political will. By using his bully pulpit as one of the most widely-distributed columnists in the province and President of the Legislature Press Gallery to spread misinformed crackpottery about this topic, he deliberately undermines the political will required to take action. He helps relieve our leaders of the responsibility to lead. His ongoing efforts towards agnotology are a real disservice to his industry, and the public he claims to inform.

…on the bike race

I didn’t want to write this blog post, for a few reasons.

First of all, I hoped that we would be building excitement right now for a bike race in Uptown a month from today, but that is not going to happen. Secondly, I had hoped that the process through which we got here was respectful and transparent enough that I would not have to engage in after-the-fact record straightening, because my doing so will be perceived by some in the community as my being unnecessarily confrontational, accusatory, or “political”. I hope I can demonstrate that is not my intention, as apportioning blame is not my interest, improving the process is.

My disappointment that the race is not going forward in 2016 has been shadowed by my disappointment that withdrawal of support for the road closure is being characterized as an arbitrary and capricious decision by City Hall. The quote

…the City of New Westminster, for unspecified reasons, has unilaterally cancelled the Hyack Grand Prix…”

does not fairly reflect my experience, and I have to address it.

For context, I was pretty excited about this race, and even attended a couple of organizational meetings to see if there were any potential hiccups I could help smooth out at City Hall, and so I could be more in the know in case Council had any questions or concerns. I didn’t have time to join the organizing committee, but hoped there was a way I could (with my limited free time) help out. I was actually looking forward to spending May 28th volunteering at a corner with my FR Fuggitivi friends and enjoying the race.

I should avoid speaking for the City, staff, the rest of Council or the Festivals Committee (I don’t serve on that Committee), but every impression I got from Council and Staff is that they were enthusiastic about this event, that there was good potential ROI for the City, and that there was no reason it should not happen. I never heard anyone at 511 Royal Ave speak against the idea.

It did become clear in early March, however, that some of the groundwork had not been laid to get the race going. Nothing was critical yet, but there were a collection of small issues that were not being addressed in a timely manner, giving staff reasons to be concerned about the organizing committee’s capacity to get them done in time. Most of them looked like details that were a little behind but were not yet on the “critical path”.

There were some negotiations on the course layout and safety issues, where I (frankly) was on the side of the organizers in negotiating with the City, but that was a discussion I felt was going to work out fine when CyclingBC folks were able to provide their professional guidance. There were issues around asphalt that were worked out, etc.

However, the sticking point became the road closures and impacts on the local neighbourhood. Closing several blocks of roads in the middle of the City on a Saturday has the potential to impact residents and businesses in unanticipated ways. Between the parade and the bike race, these closures were stretching to 8+ hours. If you ran a service business that had limited access to its front door on your busiest day of the week, you might be concerned (alternately, if you ran a pub or restaurant with a thousand people outside of your door all day, you might be exited!). If you had no access to the driveway of your house for 8 hours on a Saturday, you may equally be concerned. God forbid if you had a concrete pour on your construction site or a backyard wedding planned that day.

No problem, the City does this type of thing all the time. We have street festivals, we have parades, we do utility work. There are protocols for communicating with residents and businesses, assuring organizers have approval from them (or not) and that those approvals are crystal clear about what the type and duration of the disruption will be. It is clear with the organizations running these events that this is their responsibility, and although the City will provide guidance, the leg-work to get this work done to the satisfaction of the City is up to the organizer. It is simply a resource issue for a small municipality.

There will (almost) always be a small number of people who oppose the closure for whatever reason, valid or not. As the event is something the City and Council supports, staff are ready to deal with that small number. If there are a small number of residents or businesses that oppose it, we will talk to them, try to figure out how to accommodate their needs, make adjustments, or even (at times) tell them to get over it, because this is coming, and your neighbours all want it, so heads-up!

In early March, it was becoming clear that this consultation with the neighbourhood was going slowly, partly because of resource limitations of the organizer, partly because of some communication problems between the organizer and the City, and partly because of some disagreements/negotiations around expectations. This aspect of the organization was becoming the critical path, because if public notice was not completed to a level that made the City comfortable, then the City was not going to dump a bunch of resources into the following steps, knowing that the event may not go on. Again, limited resources require careful governance of those resources. Timing of this consent is also critical because the City needed time to manage those few residents or businesses that may not agree, to be fair to those people.

Through March and into early April, there was a significant back and forth between staff and the organizers, it was clear that the organizers felt they were doing an adequate job in this outreach, and staff were not as confident. Deadlines, first soft then firm, were set and passed. When the Festivals Committee reviewed the level of preparedness for the event, this critical gap was identified, and the Committee recommended to Council that we consider cancelling the event. Staff felt that this work had dragged on too long, and there was limited time to complete a long list of critical next steps.

The week after that recommendation was challenging for me, for staff, and for the organizers. I personally contacted the organizers in order to better understand the situation form their point of view. I had other concerns about the event (management of timing, parking arrangements for racers, a few course layout concerns, etc.) but I honestly thought they were going to get over this gap with liberal application of shoe leather, elbow grease, and salesmanship. I had enough experience with smaller bike races in my earlier days that I know how things can come together at crunch time.

I met with staff and looked at the public outreach data they were using to make their assessment, and I agreed with them. I was sent data from the organizers, and was challenged to rectify the two datasets and change my opinion about staff’s assessment. I arranged for a meeting with the organizers and representatives of the Festivals Committee to sit down and discuss how the data the organizers provided did not fulfill staff’s expectations about public contacts. following this, there was yet another meeting the between staff and the organizers to further compare notes. I cannot emphasize enough that all of this took place in an effort to make the event happen. We burned a lot of staff time (and overtime), at a level we would not have done for a commercial enterprise, film company, or most other volunteer events. City staff bent over backwards trying to see the situation through the organizers’ lens, and I feel they tried earnestly to get to a place where they could responsibly recommend further support.

Councillor Harper (representing the Festivals Committee) and I took the extra time to set up and attend these meetings, to dig into the data, and to consider the options. In the end, we had to agree with staff that moving ahead in 2016 was not the responsible thing to do. It didn’t serve the City, the organizers, or CyclingBC.

At every step of the way here, we were in communication with the organizers, and the City repeatedly made clear what its expectations were. There was nothing capricious in the decision, nor should it have been surprising to the organizers. I think staff made the right call in a difficult situation, and I support them, even if it means we cannot have an event in 2016 that I was very much looking forward to.

I hope that we can try again in 2017, and through this experience we can tighten up the way we set and address the City’s expectations. It appears we need to start consultations earlier and perhaps the City needs to set firmer deadlines instead of only giving guidance. Lessons were learned through this.

I think the relationship between the City and the organizers, clearly fractious in the past, was in this case business-like and respectful up until the end, and I hope this disappointment does not erode the progress made. That is part of the reason I was reluctant to write this blog post, as I don’t want fuel thrown on a spark. However I equally cannot stand silent while the motives and professionalism of the City’s staff, Committee, and Council are questioned in the social media. I think there are things the City could have done differently, but there are definitely things that the organizers could have done better, and should have done better. I own a bit of this, as I was probably not as proactive as a self-assigned liaison as I could have been, especially earlier in the process. However, both Hyack and the City were pushing the envelope a bit, getting into organizing an event they had little experience with, and I think it was valuable learning experience. I hope it pays off with a great event in 2017.

That will require a continued business-like relationship and respectful communications on both sides.

Myths and Lies

There is a lot going on right now in the transportation file in the Lower Mainland, both good and bad news, and I can hardly keep up, never mind blog about it. So while the local radio stations stoked anger a couple of weeks ago about another TransLink “outrage”, I had something completely different to get angry about: this “Fact Scheet” produced by the provincial government in regards to the Massey Tunnel replacement project:factsheet

After venting into a Word document, I put it aside and relaxed. Writing is good therapy, and I figured I would edit it up and make use of it later. Anger abated, back of mind, life goes on. Then last week I was triggered to pull it back out by this post by Transportation Economist Stephen Rees (someone you should be reading – his knowledge and insight are unique and powerful), and his writing:

I must admit that when I read it I became almost incoherent with rage.

Amen, Brother.

Why “rage” about a seemingly innocuous two-page fact sheet produced to hard sell a key government project to the business community? Because almost every proclaimed myth-busting point presented on this definitive piece of Government paper is a lie. A stinking pile of bullshit that anyone who has spent any time learning about transportation policy in the western world over the last three decades can smell from a mile away. And it is printed on Government letterhead. I’m angry that either people in the Ministry of Transportation don’t know it is all bullshit, or they do know and are still willing to publish it. I’m not sure which is worse.

That last paragraph may seem inappropriate to some of my readers (Sorry, Mom!), but please let me assure you, I use the term bullshit in the strictly technical sense of the word. And someone needs to start calling this government out on their lies.

The “myths” hit the news two weeks ago when the Minister presented his case for a 10-lane bridge to the relatively receptive audience of the Richmond Chamber of Commerce. At the event, he was suggested to have “busted” some myths about the project, being spread by what he called “rumour-mongers, conspiracy theorists and those with apparently ill-informed opinions”.

Let us look at the Myths seemingly busted:

myth10

If we define “The project” as a 10-lane high level bridge, then clearly it is not the only solution to the problems presented here. Traffic congestion in the tunnel has been demonstrated to be getting better, not worse, over the last decade, and the Ministry’s own data shows that 87% of vehicles in the tunnel are cars (almost all single-occupant) while more than a quarter of the *people* going through the tunnel are in the 1% of vehicles that comprise the inadequate transit service through the tube. Providing better options for only 15% of the people who use the tunnel would virtually end congestion, leaving a bunch of money left over to finish the work to make the tunnel earthquake safe again. Saying “we need to do something” is not the same as saying “we need to do this thing”. This project is not needed. Myth not busted.

myth9
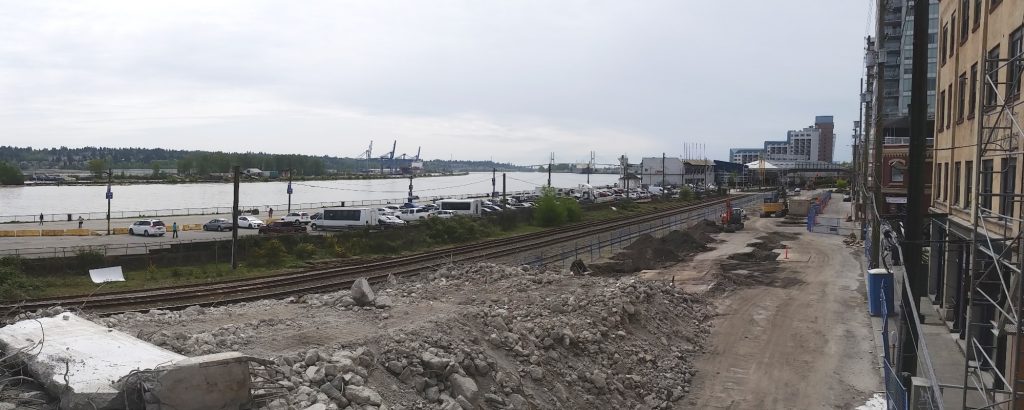
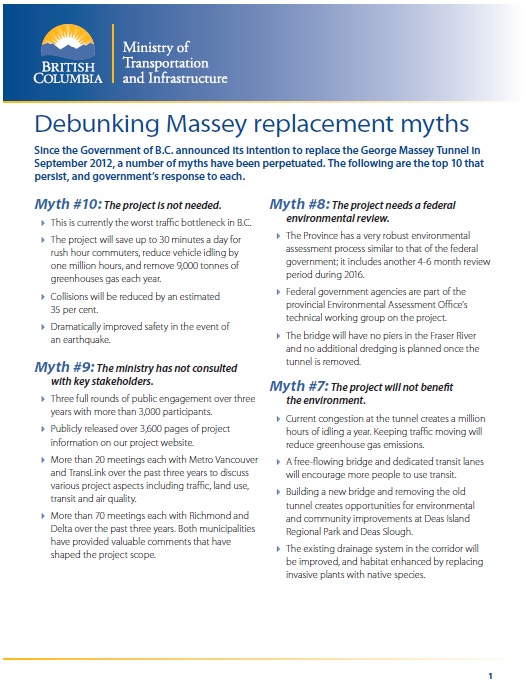
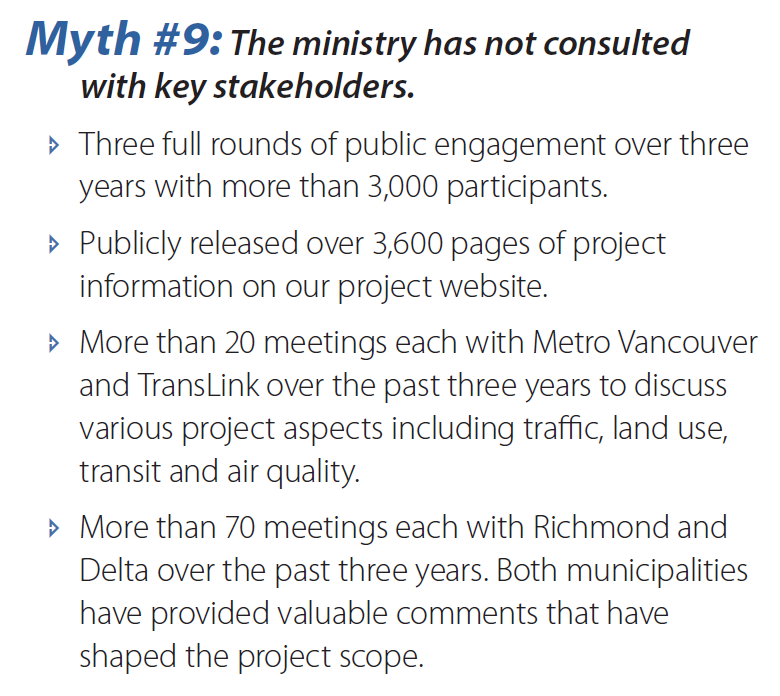
There is no doubt the Ministry has talked to many people, but to say they have “consulted” is quite the stretch. The City where the majority of the project has taken place is claiming they have not been listened to, and are not in favour of the project, the regional government is opposed, as are all of the local governments (save one). No defensible business case has been presented answering for the project. The parts of the “3,600 pages of Project Information” that referred to costing and SWAT analysis were redacted.

One way to tell that “consultation” has not occurred: No aspect of the plan has demonstrably been changed to address the concerns of people consulted since this 10-lane bridge solution was first presented to the public. They started with a 10-lane high level bridge solution, and ended at it. Myth not busted.myth8

They are right, no Federal Review is required by current legislation (assuming that other accessory projects like removing the old tunnel and re-routing of the BC Hydro line that uses the tunnel are separate projects). This is because the gutting of the Canadian Environmental Assessment Act by the Harper Conservatives in 2012 significantly cut back on Federal Review guidelines. Myth busted, but probably not something to be proud of.

myth7

What a steaming pile this is. “keeping traffic moving to reduce GHG emissions” is a perfect example of bullshit: it’s not wrong, it’s just stupid. Ways to reduce GHG impacts of transportation have been studied to death, and yes, idling reduction (depending on conditions) can reduce gas consumption per kilometre, but it does not reduce GHG emissions anywhere near as much as dozens of other available techniques, including modifying trip-making choices, increasing vehicle occupancy rates, shifting (freight and passengers) to more efficient modes, compact community planning, etc. etc. – policies that are directly undermined by this very project! Claiming that “free flowing traffic” induces transit use boggles the mind. The other “improvements” and “enhancements” listed here could easily be funded at a fraction of the cost of building a $3.5Billion bridge, without the boondoggle hanging over it. Why is planting a tree contingent on laying asphalt, what does one have to do with the other? Myth not busted.

myth6
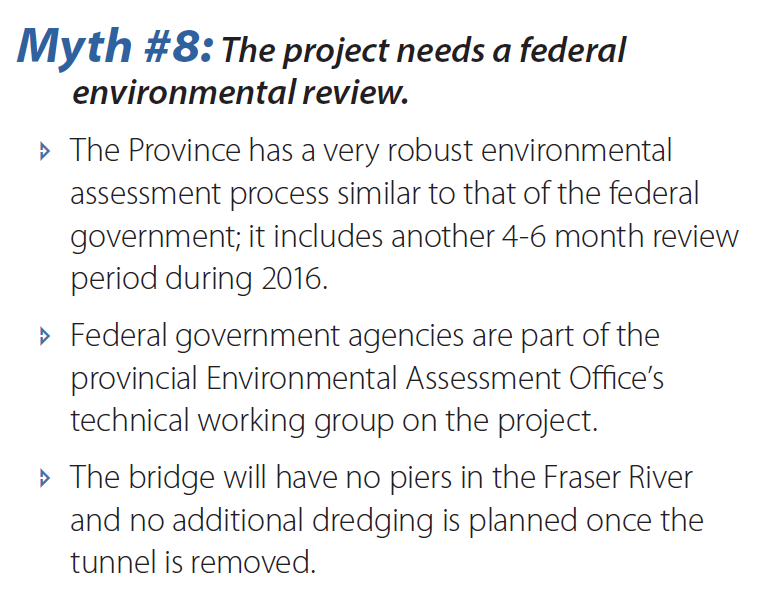
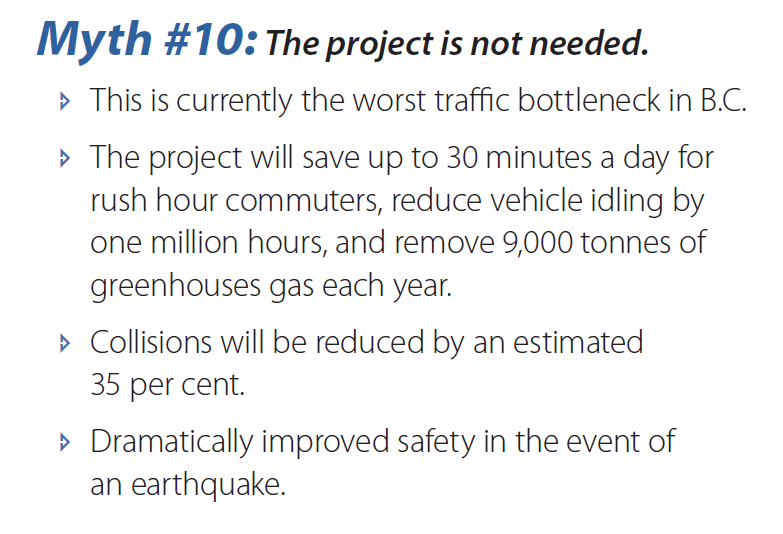
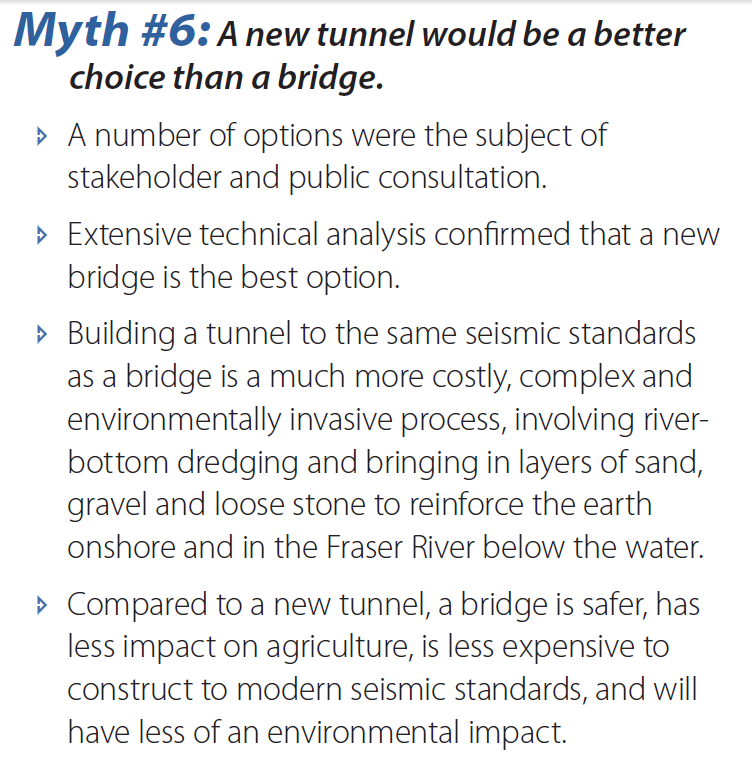
This may very well be true. But you know what is cheaper than building a new tunnel and cheaper than a new bridge? Making the infrastructure you already have work better. One of the more galling parts of this entire project is that no-one seems to be looking at the opportunity cost of a $3.5Billion infrastructure investment – what real improvements could we build to the regional transportation system with that kind of money. Perhaps start here.  Myth busted, not that it is relevant to the argument.myth5

Seriously. The Ministry is arguing that the route that now has 4 lanes will be congested on opening day if it has 8 lanes, but will allow free-flow until 2040 if it has 10 lanes. Chew on that for a bit. Just let the magical thinking sink in. Then remember, these are the guys who projected traffic demand for the Port Mann. Myth not busted.myth4

There is a lot of creative work here to not directly address the assertion that is being made. The bottleneck is irrelevant to this point (as we know there are too many other more affordable ways to address a bottleneck that is 85% single occupancy cars). The height of the Alex Fraser is irrelevant as well, as that is not currently a limit to crossing the tunnel. The word “dredging” is not raised at all in this retort, nor the evidence that deeper dredging in the river is a long-established goal of the various port authorities and port operators on the south arm, or that the tunnel is currently the largest impediment to a deeper channel. Myth not busted; Myth deftly avoided.myth3

This is the “myth busting” that caused Stephen Rees the most rage, because it is completely separated from reality, the reality that he has spent a distinguished career studying on two continents. There are no transportation planners, transportation economists, transportation engineers, or rational human beings who believe that more than doubling the capacity at the tunnel will not increase traffic congestion at the Oak Street Bridge. Their denial of this basic reality is simply a lie. To get the count of “60% stops in Richmond”, they had to count all of the traffic leaving the 99 to go on the East-West Connector and the Knight Street Bridge as being “Richmond” traffic. And yes, those routes will also become more congested, calling for more future “improvements”, because of the induced demand this project will bring (more on that under Myth #1). Myth not busted.

myth2
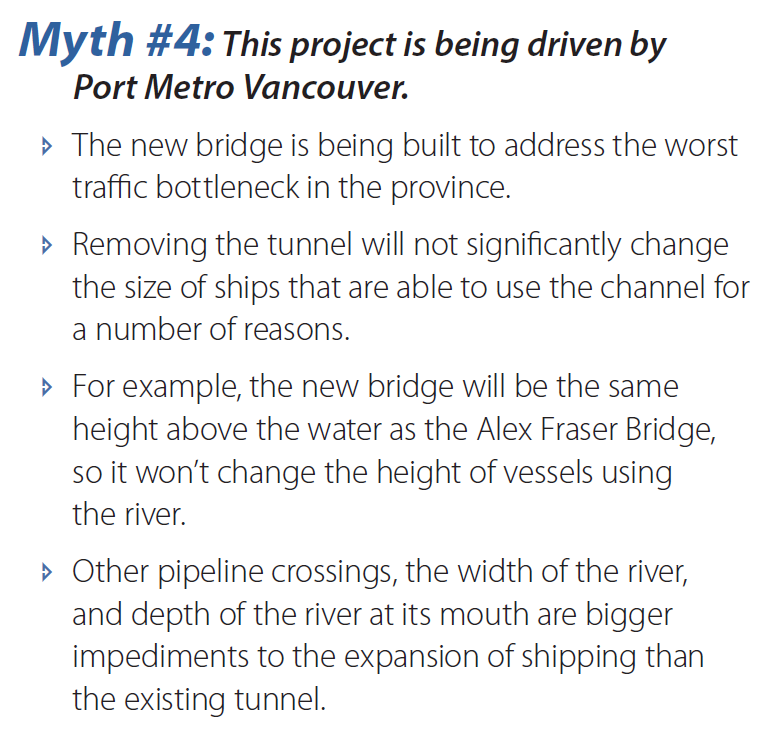
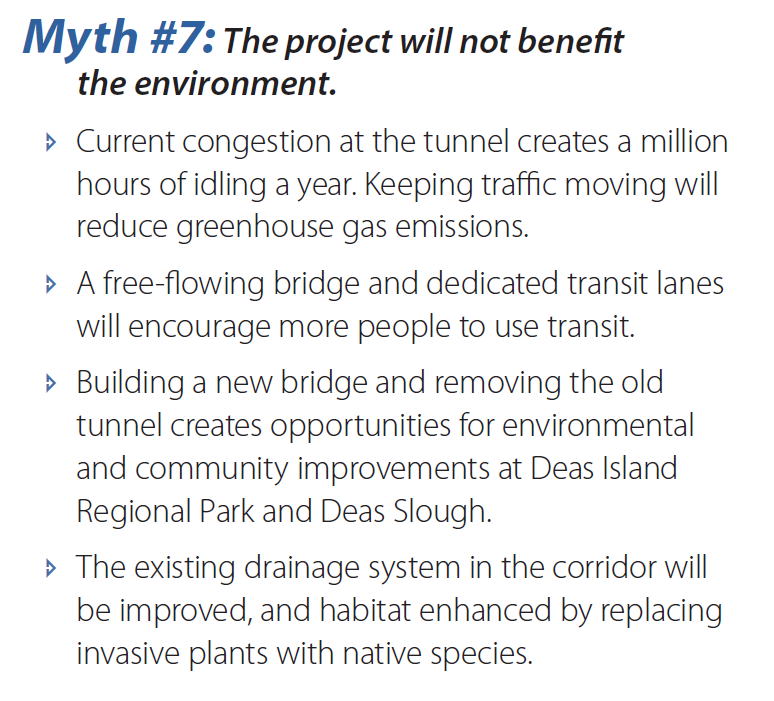
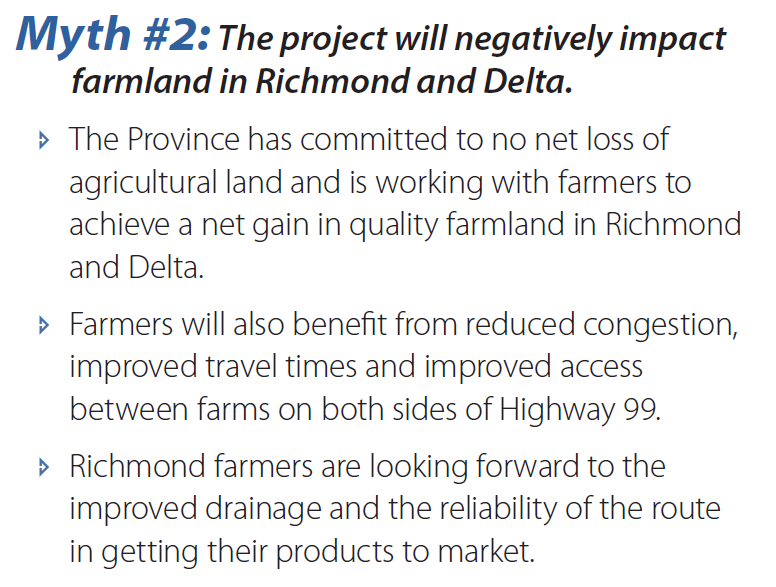
Did you know that Highways are allowed in the ALR? Much of the South Fraser Perimeter Road is actually in the ALR, no exclusion necessary, just compensation paid to the property owner who has his acreage bisected or cut off. So the Ministry can put the entirety of this project on ALR land and claim “no net loss” of ALR land- although admittedly it is hard to farm asphalt.

I cannot find any evidence (outside of Ministry pieces like this) that farmers on either side of the river support this project, nor does their business case or other consultation material explain how putting hundreds of acres of farmland under asphalt could result in “net gain”. I have read stories of farmers expressing concern about various aspects of the project. I have also heard farmers speaking about the increased pressure on farmland, the inability to afford to farm on farmland with price speculation pushing up farm land prices because of projects such as this which encourage auto-oriented sprawl in valley communities. I have also read about the Port buying up farmland in Richmond to build cross-docking facilities that will be linked to this project with shiny new roads. Myth not busted.

And to top it all off:

myth1

This is pure, unadulterated bullshit. If the Ministry of Transportation can show us an example (from their alleged “experience here and around the world”) from a growing industrialized economy where adding highway capacity has not resulted in increased highway use, they should bottle it and sell it to Los Angeles, or Dallas, or Houston, or Atlanta, or freaking Hanoi. This magic solution to congestion will pay off better than LNG. That increased capacity equals increased congestion is such a well-established concept in transportation planning that it is actually called The Fundamental Law of Road Congestion by the people who study this stuff as an academic discipline. To deny this is to deny gravity, or evolution, or the atomic model. Myth not busted, but supported by a Fundamental Law.

On this blog, I’m trying to be solutions-based. I often write things that sound critical as a search for solutions, as a way to force myself to look deeper at issues, do some research, understand the counter-arguments against my point, so I can do a better job when I have to make a decision. The Q2Q bridge is an example where I am less and less certain about how to move the project the more I learn about it. Although I am still hopeful we can find a good solution, I am increasing cognizant through stages of planning and public consultation of just how complicated a project it is, and that no matter what we do, someone isn’t going to like it. And I’m trying, really hard, to stay realistic and evidence-based on this project. When I point out numerous flaws to one specific approach, it isn’t just to be a boo-bird or support “the forces of NO”, it is to challenge assumptions and try to understand *if* the idea will work, which is often easiest to do by figuring out why it won’t. That is, I suppose, a result of my training in science, where we work to find reasons to reject null hypotheses. Or maybe I’m just a detail-mining jerk.

Then I get confronted with a project like the Massey Tunnel Replacement. This is a project with no reasoned justification, no supported business case, no alignment with any other regional plan or transportation initiative. It is a megaproject that stands in opposition to regional growth plans, regional transportation plans, and provincial and federal GHG reduction plans, and will undermine them all. It’s a bad idea at a bad time, badly presented for bad reasons. It is a bad idea so bad even most of the arguments against it are bad, but are still better than the arguments for it. And this is why I get angry even writing about it.

That is what your money is building, folks, a 10-lane $3.5Billion concrete edifice to bad ideas, now being bolstered by bald-faced lies by people you are paying to tell them to you. If you are not angry about this, you need to start paying attention.

Utilities 2016

As we are deep in to budget times at the City, I wrote a couple of previous posts comparing the amount of tax collected by New Westminster, and the rate of tax increases in New Westminster relative to the other Cities in the Lower Mainland.

If you are a homeowner in New West, you also paid your annual utility bill recently, and you may have noticed the rates for utilities are going up faster than your taxes. So it is worthwhile comparing between municipalities, as the way they manage their utilities has an impact on the taxes you pay, and the cost of living in your community.

First off, I removed the very rural municipalities from this analysis, mostly because the comparison of apples to apples is difficult. Anmore, for example, has no municipal sewer service, so every resident has their own septic field. Water services on Bowen Island are limited to parts of the community, and the level of service provided to Lions Bay and Belcarra is very different than in major communities.

Even within the “bigger” communities, there is variety. The Township of Langley provides about half of its water through its own groundwater wells, White Rock has its own groundwater supply for 100% of its needs, where pretty much everyone else who charges for water gets it from he GVRD. Large numbers of Langley residents and smaller numbers of Richmond, Pitt Meadows or Maple Ridge residents still use septic fields. Trash collection services vary widely across the region.

I have done my best to compare the cities based on the numbers they made available on their websites (as of March 1, 2016 – yes I wrote this pose a few weeks ago and just haven’t had a chance to put the graphics together). All the numbers shown are the published 2015 rates, except for two Cities that have already published their 2016 rates and purged their 2015 rates from their respective web sites, which I label in the diagrams below. So the numbers you see don’t reflect the numbers on your bill this year because I am comparing 2015 values, because that is the data available.

To start with Water Services, it is important to note that some municipalities meter their water, some charge a flat fee. If there is a flat fee available, I listed that. If only a metered rate is available, I calculated the amount they would pay if the household consumes the Lower Mainland average of 350 cubic metres of water per year.

water
Average household water bill per municipality. Flat Rate for Single Family Home or metered rate for 350 cubic metres.

As you can see, New Westminster is about the middle of the pack, and slightly less than the regional average of $519. Surrey is especially high as their flat rate is somewhat punitive to encourage voluntary metering, whereas West Van is fully metered and charges pretty high rates (all of those single family homes on large lots, high slopes, and hard rock result in significant infrastructure cost for their utility).

The sewer utility comparison tells another story. New Westminster is the second most expensive city in Greater Vancouver for sewer rates:

sewer
Sewer rates for Single Family Detached homes, including drainage rates if run as a separate utility. For metered municipalities, 350 cubic metres consumption was presumed.

This can be partially blamed on the age of our infrastructure (we need to put more into reserves sooner to plan replacement/upgrade) and a large amount on us still having a large proportion of our sewers not source-separated. We send a lot of storm water to the treatment plant, and that is really, really expensive way to deal with it. The alternate is to accelerate our source separation program, which also happens to be very, very, expensive. There is a whole blog post to be written on this point alone, so I’ll leave it be for now.

Finally, garbage and recycling programs vary probably the most between municipalities. As some Cities have bi-weekly trash collection, and vary greatly in the volume of different waste types they collect, I tried my best to compare to the “baseline” in New Westminster, which is 120L trash and green bins, unlimited recycling bins.

waste
Municipal solid waste / organics / recycling rates per household, assuming 120L bins where options exist.

As you can see, New West is slightly below the middle of the pack for solid waste services. This reflects two competing trends. Our city is compact, which should reduce the cost for trash collection, but we have one of the largest percentages of residents not living in the Single Family Detached, where trash is collected commercially and not by the City, which hurts our economy of scale somewhat.

Put these all together, and here is where all Municipalities compare on utility rates:

allute

We are the 5th most expensive Municipality out of 17, firmly in the top third, almost completely driven by our higher sewer rates. As there is a complex interplay between tax rates and utility rates, it is interesting to add our average residential tax per household number from this old post to the amount we pay in utilities, to show a closer approximation of real costs between Cities:

combo

Not surprisingly, West Vancouver with the highest taxes and the highest utility rates, is standing tall compared to all others. It is more interesting to see Surrey with its very low taxes jump up to the middle of the pack because of higher utility rates (driven in this analysis, by the punitive “non-metered” water rates, a Surrey resident can probably save $250 a year by getting a meter, which would put it down around Pitt Meadows overall). New Westminster, as expected, is somewhere down on the low side of average, 11th of 17 municipalities.

So what does this all mean? Not much, especially as this is a bit of a jumble of data – a combination of sources with great citations, but combined in a way that would get me laughed out of accounting school. Overall, though, it does suggest that New Westminster is not running its City anomalously less or more efficiently than any other city in the region. New Westminster does not have the costs or services of West Vancouver, but spends more than Langley City. Outside the few anomalies at the ends of the charts, it is probably not surprising that similar cost drivers overwhelm wildly varying political philosophies, and most Cities in the region have found a way to balance the needs and desires of their residents within very similar funding envelopes.

Ask Pat: Safety Dictator

Nicole asks—

Since your wonderful idea of a 30 km/h urban speed limit has drawn some ire, what other controversial things might you do to make our roads safer if you were made Dictator of BC for, say, a year? (I am guessing that photo radar is very high on the list, if not number one.)

Ire!? If an idea doesn’t draw ire from some sector, it is probably not worth even discussing. You may have heard some ire, I heard a lot of people saying its about time. Just this week, there were articles in Price Tags (Vancouver’s best Urbanism portal), there have been great results out of Toronto on their speed reduction program, and Seattle has joined the fray. I even took this photo at the Janette Sadik-Khan talk in Vancouver on Tuesday night:JSK20

Ire be damned, I want our streets to be safer. As JSK herself says: “When you challenge the status quo, it pushes back. Hard.”

I like the tone of your question, however. What would I do if I was Dictator for a year and was able to do whatever I wanted to make roads safer? Not sure I could get it all done in a year, but Dictators have armies to do their bidding, right?

Photo radar has it’s use. The Pattullo Bridge is a perfect example of a 50km/h road where everyone goes 80km/h and the resultant accidents are incredibly dangerous for other bridge users. It also reduces the inferred safety of the bridge, and is used as a primary reason for replacement. With careful application and an emphasis on safety (as opposed to punitive punishment in places where poor road design encourages speeding), photo radar has a role.

Look at this stupid road. Nothing here tells you to go 60km/h, except the sign. Of course everyone goes 80
Look at this stupid road. Nothing here, not the >3.5m lanes, not the generous shoulder and fixed divider, not the wide-open sight lines, nothing tells you to go 60km/h, except the sign. Of course everyone goes 80 or faster. A silly and punitive place to put Photo Radar, but dollars to donuts, the first place it would be installed.

I also think intersection cameras have a role. There are some in New West, and ICBC and the Integrated Road Safety Unit have a program to support them. However, they seem to concentrate on the red-light runners, likely because it is the easiest thing to enforce with a camera. I’m just as concerned about illegal turns, failing to yield to pedestrians, and entering intersections you have no possible way of exiting in order to “beat a light cycle”. With all the talk of distracted pedestrians and dark clothing, it is a pretty important point that the majority of pedestrian fatalities are caused by the driver failing to yield right of way in an intersection.

To make roads safer for cyclists, I would start by implementing (almost all) the recommendations that the Ontario Coroner released a couple of years ago after investigating cycling deaths in the province. I wrote a long piece on this once, but in summary: build safe infrastructure for cyclists, improve education for school students and all drivers, pass a 3-foot rule, and so on. We already have a pretty good idea what works, this isn’t radical or anything surprising. All that is lacking is the politcial will to make it happen.

The next big step would be nothing less than a complete re-writing of the design standards for urban streets. This is major part of Janette Sadik-Khan’s thesis for road safety. The existing standards for road design, paint markings, signs, and other treatments are from a different era, and were developed with the desire to make driving through our cities as efficient as possible, with only a nod to driver safety. That the “efficient movement” of cars makes the environment for all other road users less safe does not seem to be addressed.

JSK points out the American road design bible (“Manual on Uniform Traffic Control Devices”) has more than 800 pages of diagrams and plans describing the standards, 800 pages in which not a single pedestrian is shown. This book (along with it’s Canadian version) needs to be thrown away.

The good news is that there is already a lot of work being done on a better book to replace it. The National Association of City Transportation Officials has a go-to book called “The Urban Street Design Guide” That needs to become the standard, not the alternative. We can no longer use a 1950s guide book to adapt our 1920s streets for 2015 users. Time to challenge the status quo.

This probably exceeds the authority of the Dictator, but I would also change the laws to make cars safer. This engineering work is being done primarily in Europe, and some of it is becoming mainstream, but we can and should make more changes sooner. This includes a suite of things: better crush zones in front bumpers; softer hood materials with larger energy-absorbing gaps between sheetmetal and hardpoints; use of active cushioning (airbags); injury-reducing body shape geometry; larger windows with smaller pillars to improve driver visibility; active and passive collision avoidance systems.

While we are at it, we can add regular vehicle inspection to assure these systems work, and have not been messed with. There is no place in the urban environment for the suite of modifications that make automobiles unsafe for the people sharing the environment: trucks lifted to ridiculous heights, bull and grill guards, black tinted windows and lights, etc. I know that this is a radical idea in a society where many people consider their car an extension of their personality, and anything that impacts the design of their car would be seen as squelching freedom of expression.

Talking about Freedom of Expression, I am a keen follower of the move to change the language of traffic crashes. Read your local newspaper about a pedestrian being killed by a driver, and the headline is usually some form of “Pedestrian killed by car”. The events are always referred to immediately as “accidents”, which makes them sound inevitable, something that just happens, and presumes there is no fault (and, by inference, nothing we can do about it).

We can change how we value public space and our expectation of pedestrian safety by simply changing our language. “Pedestrian hit by driver of car” makes it clear there are two people in the transaction, not a person and an inanimate object. “Collision” and “incident” are both better terms than “accident” until the police and ICBC have an opportunity to determine the cause of the collision (inattentive driving? texting while walking? bad street design? non-functional brakes?). I think words mean something, and the words we use frame the discussion we will have, and we need to have a better discussion, because people are getting killed and we should have no tolerance for it.

Boy, I really sounded like a Dictator there, eh?

Toll comment

I received this comment to my previous post about $1 tolls:

Another big problem, amongst others in this plan, is that it does not fairly distribute the burden on all Lower Mainland residents. I notice that nobody seems to think that the Burrard, Granville, Cambie, No. 2 Road, Dinsmore or either of the Moray Channel Bridges should be tolled. Therefore, if your objective is downtown Vancouver, all residents of Vancouver, Burnaby, Port Moody, New Westminster and Coquitlam are exempt from tolls. Ditto for any Richmond resident working at YVR. And yet, their cars place as much stress on the infrastructure and contribute to congestion/GHG emissions as a car coming from across the Fraser or Burrard Inlet.

There is a lot packed inside this succinct comment, and it deserves a fuller response that I can fit in a comment. If we decide to toll all/most bridges, which bridges do we toll?

The Mayor of Delta provided an analysis of tolling all crossings of the Fraser River and Burrard Inlet within the general TransLink area. I pointed out a problem with including the Laing bridge, as it is Federal, and YVR isn’t going to want someone else collecting tolls on their infrastructure that they built for their customers to use.

There are also (as noted in the comment) three more crossings of the middle arm of the Fraser (the No 2 Road, Dinsmore and Moray bridges) that all belong to the City of Richmond. There are also three bridges crossing False Creek (the Burrard, Granville and Cambie) that belong to the City of Vancouver. Should we expect those two cities to turn the infrastructure that they paid to build and still pay to maintain, over to regional tolling?

Should we expect their respective Mayors to take any different an opinion about this than the Mayors of the North Shore do when it is suggested their residents and businesses start paying tolls without a concomitant return in infrastructure investment for their residents and businesses?

Perhaps we are asking this question the wrong way. Instead of asking where we can toll, we should be asking what we want to achieve with a regional tolling strategy.

Although many appeal to “fairness”, that discussion usually devolves to getting someone else to pay more and the commenter to pay less. There is little fair in transportation funding. Pedestrians and cyclists subsidize drivers, transit users pay to cross rivers, drivers don’t. We all pay for TransLink whether we use buses ourselves or not. People in Vancouver are paying to build transit infrastructure in Prince George, but Prince George residents are not expected to pay for TransLink infrastructure, BC Ferries that run on tidewater are expensive, those that run on fresh water are free. It isn’t fair. Let’s put fair aside.

One thing we may try to do is manage the infrastructure we have more efficiently. The toll on the Port Mann has caused a decline in the use of that brand new and woefully underutilized crossing, and an offsetting increase in use of the aged, decrepit and congested Pattullo. When (if?) the Massey and the Pattullo are replaced with tolled crossings, the Alex Fraser is going to be a gong show. The idea of balancing tolls across the region is one way to address this issue.

Of course, flat tolls on all bridges is a pretty inelegant and inefficient way to do this. Dynamic tolling where off-peak crossing costs are lower than peak times, and even (gasp!) temporary reductions on some alternates when an incident or construction is causing one crossing to be jammed, are possibilities that could make our existing infrastructure carry loads better, and make road use more predictable. Of course, this is effectively the same thing as increasing capacity, and induced demand will result in the same net congestion within a few years anyway. Which brings us to the third (and best) reason to toll crossings.

Transportation Demand Management (TDM) is the only thing (emphasis needed here: *The. Only.Thing.*) that has ever been effective at reducing traffic congestion in urban areas. When we talk of “road pricing” or “congestion pricing”, we really mean using the forces of the market to adjust traveller’s behaviour. Airlines do it (it costs more to fly on Friday and at Christmas), Ski Hills do it (it costs more to take a lift on a Saturday in December than a Tuesday in March), Ships, Trains, Busses, Car Rental companies, hotels – they all do it. Charge more at peak times and less in slow times to encourage some percentage of riders to take the off-peak trip and save your need to build more capacity.

Except when we talk about an integrated regional transportation system, we can also incentivise different uses altogether. And herein lies some of the answer of which bridges we should toll.

If your objective is downtown” is a compelling part of the comment. Translink constantly reminds us, the living in the burbs – working downtown model does not apply to Greater Vancouver (reason #437 why the PMH! Project was a silly approach). Look at this compelling diagram from BTAworks  that shows where commuters travel. Most people from Surrey don’t commute to Vancouver, nor do most people in most communities.

JtW2011
Source: http://www.btaworks.com/wp-content/uploads/2014/07/JtW2011.jpg

However, there is no doubt the region has “zones” for the most part defined by water bodies, and just like we use those zones to determine transit use, we can use them to determine tolling policy.

The model suggested by the Mayor of Delta would divide the lower mainland into the following zones: the Mainland, South of the Fraser, Lulu Island, the North Shore and the North Valley.
map1

Although I admire the simplicity, this does seem to create significant inconsistencies, and as the commentor noted, if I want to drive the 45km from Anmore to UBC, I pay no toll, while I would pay two tolls to go the 12km from New West to my favourite Indian Restaurant in North Delta (and this is, like most things, all about me).

This also creates as bit of a strange zone-in-the-middle out of Lulu island, which I suspect would be of concern to the City of Richmond. Or not. Their residents may hate the idea that every time they wish to go somewhere more than 3m above sea level (and bring their car along) they need to pay a toll. Alternately, they may like the idea that toll-in and toll-out will reduce through traffic and make their City streets work better for the residents that live there. I frankly don’t understand the politics of Richmond enough to predict where that discussion would go, but I would wager less tolls would be favoured.

A perhaps more logical model I once saw suggested was to consider the Burrard Peninsula as the “central zone”, and create three other zones: South of the Fraser, the Northeast, and the North Shore:map2

This creates the slightly complicated (but not insurmountable) challenge of tolling crossings of North Road (or some imaginary line that runs roughly parallel to it). This arguably distributes the burden better. The problem is what to do with Lulu Island. Does it belong North or South of the Fraser?

The answer in that probably lies in one of the fundamental assumptions of using road pricing as a TDM measure: You need to provide alternatives. Simply tolling a crossing where people have no choice but to drive will do little to disincentivize people from adding to the traffic, but will do much to anger people who used to get a crossing for “free”. Looking at Lulu Island, the transit options to the south through the tunnel and Alex Fraser are not great. However, the Knight, Oak, and Laird currently parallel one of the nicest, shiniest, newest transit lines to ever grace the Lower Mainland. The pedestrian and bike alternatives are also there. So from a TDM perspective, it makes sense to toll the four north arm crossings, not the two main arm crossings.

map3

I agree, true distance-based road pricing is a better solution, but we are a decade or more from that being implemented, and we need to deal with a funding situation that is killing the regional transportation vision right now. Meanwhile we are bringing a bunch of new asphalt infrastructure into the equation within the next decade. I see a more regional tolling introduction as a good stop-gap measure, and we can no longer allow the perfect to be the enemy of the good. We need to get moving.

And yeah, $1 still isn’t enough.

$1 Tolls: still not enough

I’m going to avoid being critical of Mayor Jackson, because I think her accepting the idea of road pricing as a Transportation Demand Management method (even in this watered down and ineffective format) is a sign of progress regionally.

I am going to be critical of the regional media for their lack of analysis in reporting this story. It is almost as if the story wasn’t “reported” at all, but instead the press release was repeated, sometimes with a few clauses moved around, with the most minimal amount of background (“the tunnel needs replacing!”) and no actual analysis. I cannot find a single report where a member of the esteemed press even checked the math.

Here is the math the Mayor provided in her press release:

That argument in the Mayor’s release was that $1 tolls would raise close to $300 Million (not the “$348 Million” reported by one local print media source) to pay for the local government portion of the Mayor’s Plan. Aside from a few of the questionable statements in that release (an increase of 20,000 cars a day does not suggest people are “avoiding” the Pattullo Bridge), you would think reporters would check the base premise. Is spending an hour with Google and a spreadsheet really too much to ask before the story is filed?

Lucky, I had an hour in the evening to sit down and compare this report to my earlier analysis that did get a little notice a couple of years ago, the last time this idea came up. So here’s the kind of analysis I would want to read in the media, if I felt it was doing its job.

The screenline numbers from 2011 used by Delta for traffic count simply do not reflect the reality of bridge use in 2015. I was able to throw this table together based on a bit of Google searching, and note every number is a hyperlink that connects you with the actual official traffic count source of data (for the crossings where such a thing exists).

Delta data: 2015 January 2015 September 2014 Annual
“2011” MAWD MADT MAWD MADT AADT
Laing 79000 79000 79000 79000 79000 79000
Oak 88000 69166 65069 75043 71779 67376
Knight 96000 96000 96000 96000 96000 96000
GMT 89000 77306 71633 87037 82531 79105
Qboro 88000 79724 73739 87113 82706 80108
Fraser 117000 113496 103281 121079 113984 107785
Pattullo 68000 72985 78043 83598 79633 68000
Port Mann 112000 96098 87905 106378 100608 94986
Pitt 79000 79000 79000 79000 79000 79000
GEB 30000 34520 34520 34520 34520 32054
Lions Gate 63000 58857 56918 63137 61357 60757
IWMSNC 127000 120600 112697 129971 125220 117854
Total daily crosings: 1,036,000 976,752 937,805 1,041,876 1,006,338 962,025
x 365 days: 378 357 342 380 367 351

The Golden Ears Bridge data is less certain, as it comes from TransLink financial documents, and is not collected with the rigour of the Ministry of Transportation data. The Pattullo data is horribly complicated in its reporting, but available as a daily number, not as an annual average. For the Knight, the Laing, and the Pitt River, I could find no useful data. Anything I found lacked a link to who collected the data, and was too old to be reliable. For those bridges, I projected the TransLink screenline data that the Mayor of Delta used.

How much traffic you count depends on when you count it (no surprise!). The biggest number (378 Million crossings annually) is a made-up number that projected the annual weekday traffic (AWD = average week day) over the entire week. As weekend traffic is generally 20-25% lower than weekday, that automatically gives you an inflated number, so for the purposes of projecting toll revenue, you are better to use ADT – average daily traffic. It also depends if you pick a winter, summer or fall day (with fall being the busiest urban travel season). That is why I listed both January and September data for 2015.

The last year for which the MoTI provides Annual Average Daily Traffic data is 2014. This number best balances out weekdays, holidays, seasons, and other shifts. It is important to note that every bridge with good traffic count data from MOTI has a significantly lower amount of traffic than the 2011 data used by Delta to make their case. I’m amazed that this point was not noticed by any media).

Regardless, using the concise MOTI data as the best regional and pan-seasonal effort where available, and the likely inflated Delta/TransLink numbers where it isn’t, the actual number is somewhere less than 1 million trips per day, and less than $350 Million with perfect across-the-board $1 tolling.

That hefty chunk of change looks good if it ignores the issue of what to do with the existing tolls on the Port Mann and Golden Ears. If they are reduced to $1 and included in this analysis, then we have to account for the $164 Million (2014 estimate) collected from those bridges in the current regime. This problem is exacerbated by the fact that neither bridge is collecting enough toll revenue right now to cover their financing costs, and the concessionaires want to keep getting paid.

There would be many things nibbling away at the remaining $186 Million, including the cost of setting up the tolling system and the cost of administering the tolls. Based on the TREO model, and their most recent Financial Reporting, they spend about $16Million collecting $120Million, so we will be conservative and call that 12% overhead not including the capital cost of setting up the system. Giving a generous benefit of doubt, I’m going to assume they can collect a $1 toll three times more efficiently than a $3 toll, but still getting us down to about $160Million.

There will also need to be some discussion with the owners of several bridges, as the Pattullo (see below) and Knight belong to TransLink, and the Laing belongs to the Federal Government through the Airport Authority. With all due respect to the Airport’s sense of charity, they are not likely to let someone else collect revenue from their customers on a piece of their infrastructure without some form of compensation.

And finally, it raises the uncomfortable question of how much of this revenue goes towards replacement of the Pattullo Bridge and Massey Tunnel. The Pattullo is part of the Mayor’s Plan, and was slated to be funded by a toll that is similar to the one on the Port Mann. With that idea now replaced by regional $1 tolls, the revenue required to cover the financing for that >$1 Billion project will need to be drawn from an ever-dwindling revenue stream.

The proposed $3.5Billion replacement for the Massey Tunnel, a project the Mayor of Delta is almost single-handedly in support of, would surely eat up more than the remaining revenue from the regional $1 toll. It is not part of the Mayor’s Plan, and it is hard to see the Mayors of the region agreeing to divert all of the regional tolling revenue to that one project when it does nothing to address the rapid transit and bus service improvements the region desperately needs. Not to mention any improvements to the North Shore…

So $1 a crossing is far from a panacea, but this discussion may lead us in the right direction. Tolling many crossings and sharing the revenue as part of a truly integrated regional transportation infrastructure investment plan (which is what the Mayor’s Plan is) is not in itself a bad idea. Once the infrastructure is in place, then time-of-day tolling shifts and other TDM measures can be put in to better manage demand, and even take away the imagined “need” for 10 more lanes of car traffic crossing the Fraser River.

Timelines, FalconGates, Access

This is a really important story that is well reported, with a timeline that tells you more in one graphic about the history of FalconGates and Translink’s alleged incompetence in rolling out the program than you will read in a year of PostMedia whinging.

From day one, this program was doomed to the embarrassing failures we are now experiencing, and TransLink knew the disaster was in the making. However, provincial interference in the operation of what they often claim to be an arms-length organization, fueled in part by a media unable (unwilling?) to understand the problem, led us down this path. Perhaps it is time those people stop pretending to be so shocked.

It is telling that a report from way back in 2005 on “controlled access” to stations starts by stating:

Over the past several years, the public and media have maintained a strong interest in implementing “controlled access” stations on SkyTrain as a potential means to deter crime and to reduce fare evasion on the rapid transit system.

Indeed, that study showed that the public perception, fueled by media reports speculation, was that 27% of people on SkyTrain pay no or insufficient fare, when the actual number was about 5%. This perception was in part linked to a measureable shift by ridership away from single tickets and faresavers towards monthly passes and U-Pass, where the “payment” action was less visible. Ironically, this shift actually resulted in a reduction in fare evasion, as people carrying monthly passes are not going to “forget” to pay for “just this one ride”, or otherwise self-justify not paying a zone change, etc. The logical response (with a defensible business case) was to step up visible enforcement and other measures to increase the perceived security of the system, including introducing expanded Transit Police service.

Back in 2005, the Smart Card model was assessed, which brought these telling and somewhat prescient quotes:

Smart Cards can also help to improve public perception of fare evasion on SkyTrain by implementing procedures such that all customers are required to “tag” their smart card upon entering a station. This will result in some level of inconvenience for pass holders, but would help to address the incorrect perception that prepaid fare holders are fare evaders.

This [Fare Gate] approach also assumes that there would be a booth or similar location at every station entrance/gate array staffed by a gate attendant. Faregate attendants would monitor gate operations, and also allow customers to bypass the gate if they had mobility impairments, excess luggage, a ticket that could not be electronically read (e.g. a promotional pass), or some other condition that prevented them from using the gate. [my emphasis]

That’s right, TransLink staff knew, and warned their Board in 2005, that there would need to be attendants on site to help people with mobility issues manage FareGates if installed. The estimate at the time was that this would require, for all the three transit lines post Canada-line introduction, 387 Full Time Equivalents.

Almost 400 staff. No wonder the business case was sketchy, and an alternate approach to improving the (I have to keep emphasizing this word) perceived security issue was to hire less than half that number of increased security staff, not the least because this would increase actual security, not just the perception of security.

The financial analysis in 2005 dollars was $32Million per year for operational and maintenance of the FareGates, extra staff, and annualized capital costs of the system, with an expected fare evasion reduction equal to about $3Million per year. Naturally, the TransLink Board said no. One would have to be insane to do it.

Enter Kevin Falcon.

In the former Minister’s defense, he was being lobbied by the Former Deputy Premier (his former boss) on behalf of the company that eventually sold TransLink what T like to call FalconGates. These are, perhaps coincidentally, the exact technology pictured on Page 23 of the 2005 Report that deemed the system uneconomic. This company, Cubic, convinced the Minister that their system was great, and would be up and running by 2010. This advice from his former Deputy was good enough for the Premier, despite TransLink continuing to reiterate that this was not going to be economical or practical to introduce.

This makes the recent questions over whether TransLink is making its own decision or is being run directly by Victoria seem rather late and academic, doesn’t it?

By the end of 2010, the defence contractor for whom the former Deputy Premier was lobbying unsurprisingly won the contract to install the FalconGates. The program had expanded somewhat to include the incredibly complex Smart Card system already discussed, and the budget expansion by 70% was neither the first nor the last time the business case got worse than hen it was first rejected. Cubic’s history of these systems was spotty (three years delay and significant usability issues in Minneapolis, two years delay and compatibility issues with the PATH SmartLink, operational and security issues in Brisbane), but these types of growing pains should not really be surprising for what is a pretty advanced and emerging technology. These examples should only have served as warning to everyone from the CAO of TransLink to Jordan Bateman that Compass and FareGate introduction was going to be a bumpy process, and there is no evidence anyone else could have done it better.

(For the purposes of this post, I am going to set aside the inside-government-lobbying-and-late-delivery model Cubic demonstrated in Sydney with the Opal Card which is at least as sad as here in British Columbia. That was military-grade bad procurement you need to read to believe).

This takes me to last Saturday afternoon when I hopped on the Skytrain and ran into a friend of mine with severe mobility restrictions (motorized chair, very limited manual dexterity). He was rather pragmatic about the situation, and recognized the FalconGate system was going to be problematic from Day 1. However, he also pointed out that there are many other accessibility issues in the system that are more problematic than requiring attendant help with Compass. To be frank, he was much more concerned about the cutting off of disabled transit pass assistance, but as cruel as that is, it’s another digression.

This chat and my work with the Access Ability Advisory Committee around our two downtown transit stations (both with significantly sub-optimal accessibility kludges), brought me to think about my experiences on other transit systems around the world. Recently, we were in one of the 20% of New York subway stations that is accessible, which I only noted because the elevator was out of order, leaving an elderly women frantic about how she was going to get home. London’s Tube is 30% accessible, Toronto’s subway about 50%, while Montreal’s Metro is less than 10% accessible. Aside from local and temporary (sometimes protracted) maintenance issues, TransLink’s light rail and heavy rail infrastructure is 100% accessible, and our bus system is reaching towards 100% accessibility.

TransLink is far from perfect when it comes to accessibility, but as an organization they have striven to reach a level of system-wide accessibility uncommon in large city transit systems. They have invested a huge amount of money in this, because it is the right thing to do. The more accessibility you install, the more potential for it to go wrong, and I hope we can do better than to hop on every snafu as if it is a massive failure of a damaged system, and recognize it as a place where improvements have, so far, fallen short.

So to take my seemingly Fletcherian mid-post thesis shift back to the original point: I wonder how much we could have improved accessibility of the system with the $200 Million we have instead pissed down the FalconGate black hole for no other reason than to make CKNW callers feel more secure that someone else is paying to ride the train they avoid while stuck in traffic.