#NWelxn18 – poll-by-poll

The final election results are out, with poll-by-poll results. This gives us an opportunity to infer a bunch of things about the election. Note that this is more like reading tea leaves than defensible analysis, because anyone in the City can vote anywhere during a local election. We don’t know if the typical Queens Park Voter cast their vote at the Armoury, Glenbrook Middle School, or in an advance poll at the Lawn Bowling Club or City Hall. It is somewhat safer to assume mostly Queensborough voters voted in Queensborough, and the Pensioners’ Hall probably captured most of lower Sapperton, but where did Downtowners vote? There is a lot of fuzziness here, but here is a poll map:
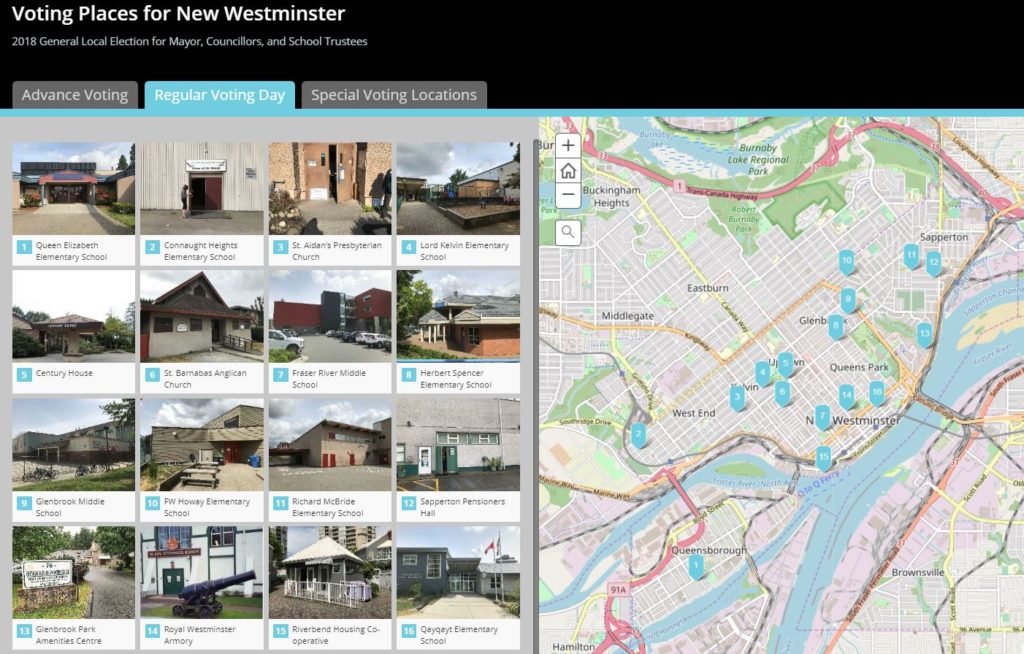
Messy data doesn’t prevent me (or some other local blogger) from trying to glean insight from it.

This table shows the poll-by-poll vote for City Council. I marked the winner of each poll in dark green, the second place in medium green, and the rest of the top 6 in light green. Orange is for the 4 people who finished just below the threshold:
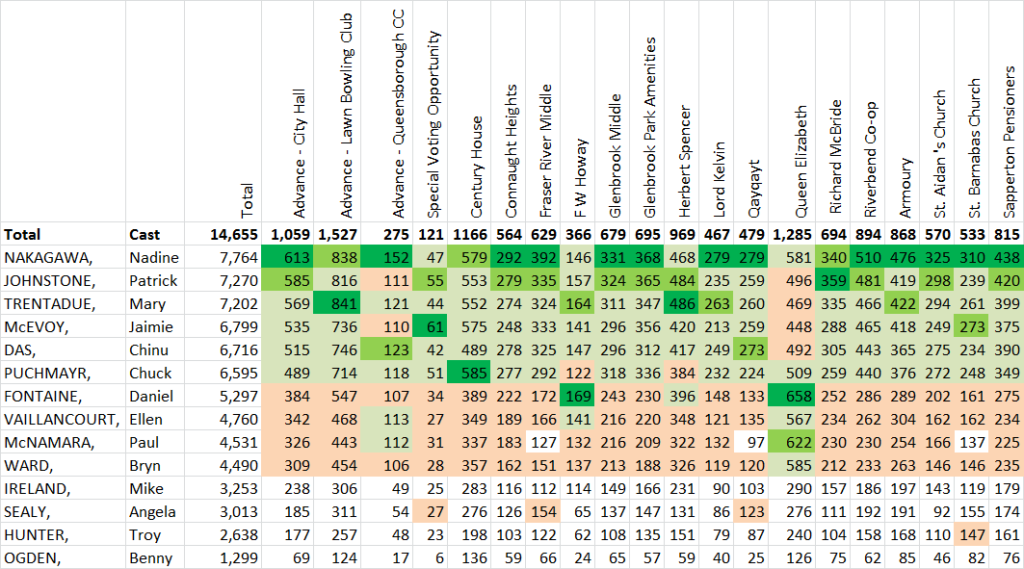
No surprise here that overall winner Nadine Nakagawa won the most polls with 13 – she not only won the popular vote, she won the Electoral College! She was also the only candidate to “place” (finish in the top 6) in all 20 polls. She dominated. Mary Trentadue and Daniel Fontaine each won two polls, with myself, Jaimie McEvoy and Chuck Puchmayr each winning a single poll. I had far and away the most second place polls, and all of those elected “placed” in between 18 and 20 of the 20 polls.

Team Cote candidates dominated almost every poll, except in Queensborough, and (arguably) Howay – the poll used mostly by Massey Victory Heights residents – where the New West Progressives (NWP) had a solid showing.

People paying attention to the campaign will have noticed that the NWP put a lot of effort into Queensborough, stoking some discontent around a few long-standing neighbourhood grievances, and benefiting from support of a small but vocal group of Temporary Modular Housing opponents. Team Cote members also did a lot of work in Queensborough (I personally knocked on hundreds of doors there), though we can look back now and say that the ~200 vote gap between the best NWP candidate and worst Team Cote candidate in that neighbourhood was hardly a factor in the overall election result.

For the fun of it, I looked at what percentage of their total vote each candidate received in the advance and special polls:
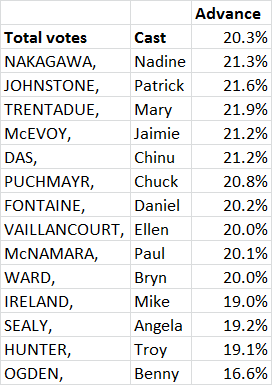
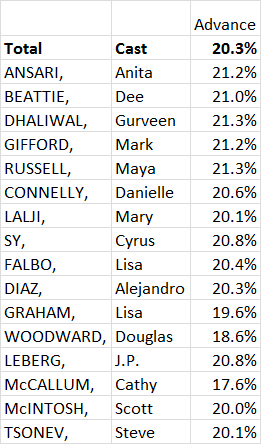
Interesting that Team Cote candidates received between 21% and 22% of our votes in the advance polls, NWPs around 20%, and others under 20%. I’m not sure if this relates to the relative get-out-the-advance-vote efforts, but it seems a consistent trend.

School Board data looks a lot like Council results, though perhaps a little more diffuse:
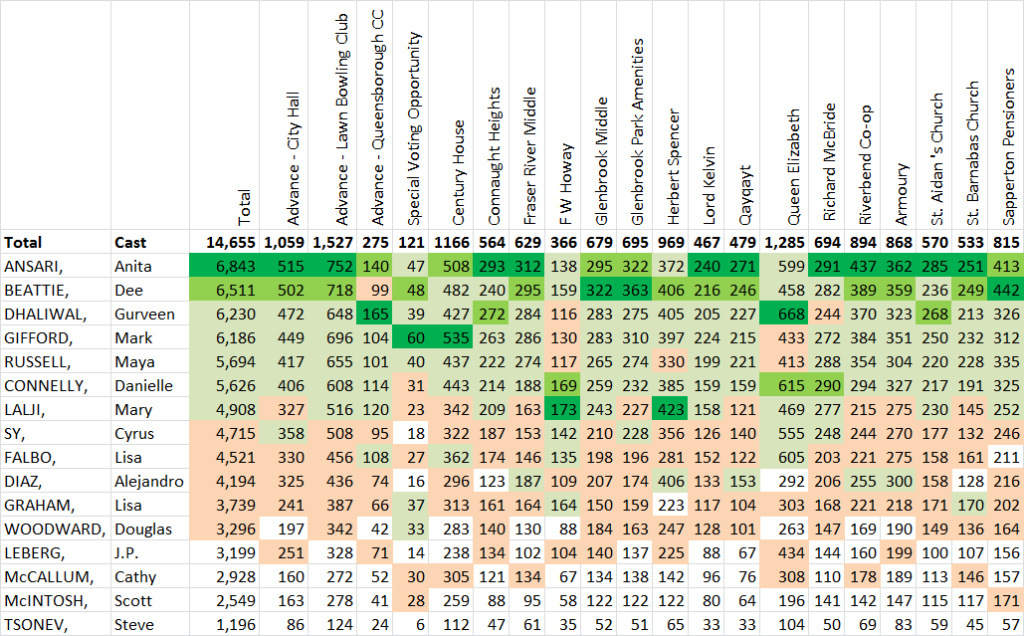
Overall winner Anita Ansari won 11 poll of the 20 polls, with Dee Beattie winning three and returning champions Mark Gifford and Mary Lalji each winning two. Queensborough resident Gurveen Dhaliwal won both polls in that neighbourhood. Beattie was second in most of the polls she didn’t win. NWP candidate Danielle Connelly didn’t win any polls outright, but did finish 2nd in three of them. Ansari was the only candidate to place in the top 7 in all polls, although Beattie only missed one (the Q’boro advance poll) as did Connelly (the Special Poll for hospitalized voters). Also note that the Team Cote candidates finished in alphabetical order – likely a coincidence, but fun to speculate about.

Mirroring the Council result, the NWP candidates did better in Queensborough than any other polling station, but also clearly had good success at the FW Howey poll in Massey Victory Heights, along with Mary Lalji. The standout among the others was Alejandro Diaz, whose success seemed to track along with Team Cote success better than the NWP, suggesting he was the most popular “6th vote” for those who voted the Team Cote ticket, where Lalji had stronger results where Team Cote did less well. Again, the Advance vote percentage closely mirrors that of Council:
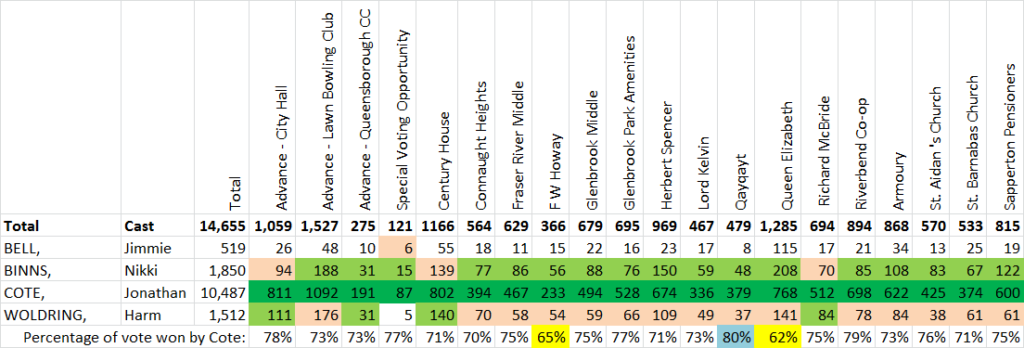
I’m not going to say to much about the Mayor’s race, because it was a blowout by pretty much any measure. Cote finished with less than 70% of the vote only in two polls (Queensborough and Howey), and won more than 80% in his own neighbourhood. Nikki Binns was clearly the second most popular candidate:
Outside of the statistical analysis, I am struggling to write a piece about “what it all means”. As someone who did well in the election, I don’t want to be seen as punching down in my analysis of why others didn’t do well. I have had a lot of conversations with different people since the election, and have heard a lot of opinions about the result. I am tempted read into New Westminster bucking the general regional trend of this being a “change election”, as seen in Port Moody, Vancouver, and Burnaby as a testament to the good work this Council has done, but getting out of my bubble a bit on this will be a challenge.

Bonus chart: Since I mention the quirk of the alphabet order of the top 5 in the School Board election, I thought I would do a quick scatter chart of election results and order the names appear on the ballot. Blue is Council and red is School Board (with best fit lines and R² provided by Excel):

The Council result is close enough to random to be considered so, but you could convince me there is something going on here with the School Board ballot…

#NWELXN18 – THE TRENDS

One of the discussions during this election (and in all local elections for the last few decades) was voter turnout. Already low across the region, there was some concern that this election would see even lower than usual turnout. We don’t have official numbers yet, but I thought it would be good to compare this year to previous years.

There was some reason to suspect lower turnout this year. As charming and important as School Trustees and City Councillors are, it is really difficult for normal people and occasional voters to connect with that level of government. Occasionally, we have a candidate who is really compelling (I think of Jonina Campbell in 2011, Kelly Slade-Kerr in 2014) who drive some increased interest, but I doubt even that draws more than a couple of percent of eligible voters. Much like federal election interest is driven by the candidates for Prime Minister (sorry, Peter), the reality is that local elections often carry the weight of the Mayor’s race. And the reality is we didn’t have much of a Mayor’s race this year. Nothing against the challengers, but they all started very late and had limited campaigns (only one had lawn signs, one other had a website, and attendance at all-candidate events was spotty). I think in most people’s minds, even those who opposed him, Cote as a safe bet to win.

However, there was also a reason to suspect turnout may be higher, and that was a well-coordinated and -funded party running in opposition to the existing Mayor and Council. There is good potential for a party with strong political connections and good messaging to drive turnout, both by their own efforts, and by forcing the incumbents to get off their duffs and work to keep their jobs. I knocked on almost as many doors this year as I did in my rookie year, and direct voter engagement – actually looking at people and telling them to vote – is the proven Get Out The Vote strategy.

So how did that all work out?

A note here, I am using the unofficial voter stats released by the City for 2018, and the City’s open data number for previous elections (we don’t yet have official numbers for 2018). I am also using population stats from the BC Government website. These numbers are not “voter turnout” in any official way. New Westminster’s population is about 74,000 people. We had just under 50,000 registered voters going into the election, though some of those people may have died, moved out of the city, or otherwise not been eligible to vote this election. There were probably a fair number of people who were eligible to vote but were not registered to do so, and registered on the day of the election. Short story: numbers are complicated, and everything below is an estimate.

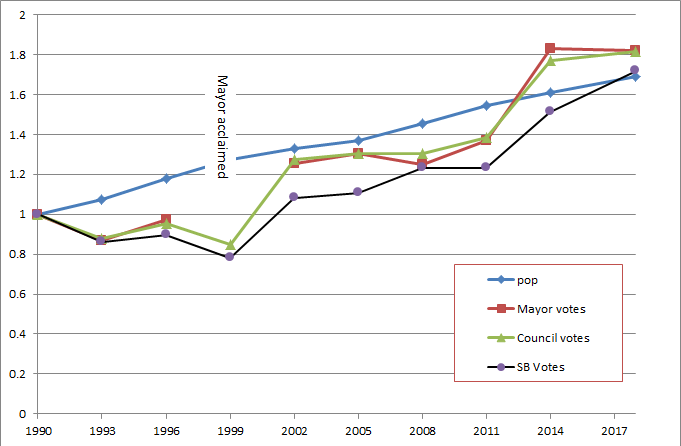
This graph shows the number of votes for Mayor, Council, and School Board for every election since 1990 (the first year these stats are provided by the City), alongside the population trend for the same period:

As the numbers are hard to compare on a single y-axis, I indexed all of them by dividing all of the numbers by their 1990 value to allow a closer comparison. Numbers below 1.0 are lower than the 1990 value, numbers above 1.0 are above the 1990 value:

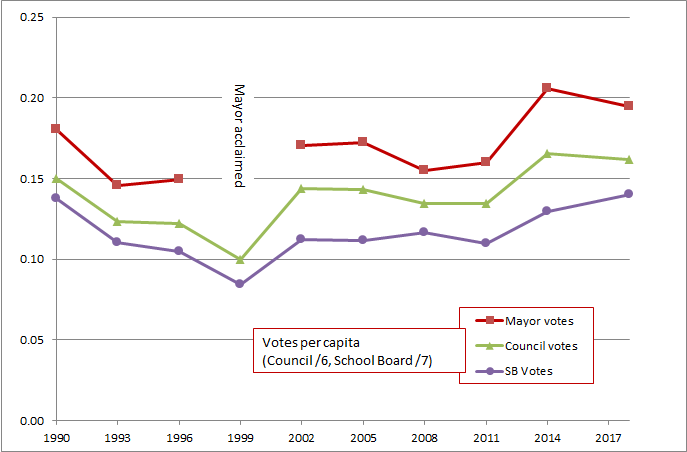
Finally, to see how the vote numbers compare to population change, I divided the Mayor’s vote count by population, and the Council and School board votes by population *and* by dividing them by the total number of available votes (6 for school council, 7 for school board). See the above caveat about this not being “voter turnout”, but it does provide a clear indication of how voter number change when population change is removed:

In short, voter turnout dropped in the late 1990s, turned around in the early 2000’s, and took until 2014 for it to catch up to the losses of the previous decade. 2018 turnout is slightly down in 2018 for Mayor and Council, and slightly up for School Board when compared to 2014.

This does show the importance of the Mayors Race. In 1999, the Mayor was acclaimed, and the School Board and council vote turnout suffered. The 2002 Election was an exciting affair with Wayne Wright unseating the incumbent by 18 votes, resulting in a jump in voter turnout across the board. The next three elections were relatively lackluster as a popular mayor won fairly easily, and the Council and School Board vote more or less flat-lined. (the 2008 School Board jump possibly related to the Grimston Park school controversy? Or am I getting my dates mixed up?). 2014 was again an exciting mayoral race with a strong-campaigning challenger unseating a popular incumbent. And much as I would think I am responsible for the huge jump in Council votes that year, the turnout across the board (if not my lackluster 5th place finish) belies this hope.

One thing that does stand out is uptick in School Board votes this year while Mayoral and Council votes were slightly down (on a per-capita basis). I would love to hear a theory to explain this. Good candidates? The fact they are finally pouring concrete for a new High School? Or perhaps it was because no group ran a full slate, so there was seen to be more room for challengers to get onto the board? Enter your theory here.

Poll-by-poll results are yet to be released, and that is where the real fun is! I will write another piece once I get a chance to chew on them.

#NWelxn18 – first the numbers

That was interesting!

I have avoided talking too much about the election over here, relying on my election website to carry the campaign load while I kept this site on the day-to-day of council life. However, I am going to spend a bit of time between now and the resumption of Council stuff in November looking back at the election.

I am still thanking my many volunteers and supporters, the feelings are still a little raw, and lots of Monday morning quarterbacking is going on, so I am going to hold off on all that stuff for a bit and start with just the (preliminary, not yet official!) numbers, starting with number of votes:

On Council, Team Cote clearly dominated, not only taking the top 6 spots, but doing so with a clear numbers gap over the members of the NWP Party (6th place had 25% more votes than 7th place), who in turn had a pretty solid gap ahead of the 4 independent candidates (10th place had 38% more votes than 11th).

Voting percentages are a little wonky for Council elections because we don’t know how many votes each voter decided cast, but there were 71,627 council votes and 14,368 votes for Mayor, so we can infer an average of 5 votes per voter. There were something like 50,000 registered voters in New Westminster, so turnout it tentatively a little over 28%, about the same as last election (the exact numbers will have to wait until the official report- as we don’t know how many voters registered on the day of the election) .

The pie chart allows a little more clumping analysis. We can see that Team Cote candidates earned 59% of the vote total, NWP candidates 27%, and others 14%. Of course, there were 50% more Team Cote candidates than the others, so perhaps a better comparison is that the average Team Cote candidate earned 9.9% of the votes, the average NWP candidate 6.7%, and the average Other 3.6%.

Nadine Nakagawa surprised even herself by dominating the vote. The last time a rookie candidate led the polls for Council was in 1996 when a young Jerry Dobrovolny pulled off the feat. The vote count of all 6 elected Councillors (7,764 to 6,595) is quite a bit higher than last election (6,262 – 5,517), though the vote count for the 7th place finishers is not that different (5,297 in 2018, 5,165 in 2014).

For the fun of it, I made a bar chart mixing this year’s election results (blue) with last elections (in red) so you can get a sense of how the vote distribution changed:

There were more candidates in 2014, which makes for a longer tail on the distribution, but this display really makes the gap between Team Cote candidates and others stand out – getting about 20% more votes than their cohort in the previous election, where the NWP had very similar vote counts as their 2014 cohorts. This was a convincing win compared to last election.


On the School Board side, things are not as clear. The Team Cote candidate still swept the top spots, but the vote count was much closer:

There also isn’t a big gap between 7th place (and elected) and 8th place (less than 4%). The NWP candidates were not clustered, it is clear there was no “block vote” for or against the NWP. Danielle Connolly got 25% more vote than the NWP average, J.P.LeBerg got almost 30% fewer votes than that average.

The average ballot included 5 Trustee votes (72,335 compared to 14,368 for Mayor, see assumptions above) – curiously the same average as for Council even with one more opportunity to vote, and they broke down like this:

43% of the votes went to Team Cote candidates, 25% to NWP candidates, and 32% to others. Again, since there were different numbers of candidates in those three clumps, the better estimate may be that the average Team Cote candidate earned 8.7% of the vote (and all were pretty close), the average NWP candidate 6.2% (with a wide spread), and the average Other 4.5% (with two candidates standing well above the average).

The comparison between 2014 and 2018 is more interesting here than with Council. There were more votes in 2018 (about 14% more), but in contrast to Council, less of that vote went to the front-runners. With more candidates in 2018 the distribution is more spread out, but it will take a smarter political scientist than me to tell what this means!

Finally, in a campaign where there was much discussion of how diversity was defined, all of the new candidates elected were women – three on City Council and six (6!) to the School Board. This, and the cultural diversity of the candidates, may be historic for New Westminster. Though it is worth noting that between 1993 and 1996, there were three women on New Westminster Council, and Betty Toporowski was Mayor. Whether a person of colour has ever served on Council in New Westminster is the kind of question you would need to ask an historian.

UBCM 2018

Apologies to regular readers (Hi Mom!) that I have not been putting a lot of content on this blog recently. The campaign is in full swing, we are still doing our regular City Council stuff, and I have another job that keeps me occupied. Hopefully back to regular programming in later October. In the meantime, I am talking more about campaign stuff on my campaign Facebook page, and on the my campaign website and trying to keep this page about City stuff that isn’t campaigning.

However, I thought it apropos to provide a quick update on the annual Union of BC Municipalities meeting. I was not able to attend this year, mostly due to work and Council commitments. I did go up there on September 10th (disclosure: on the City’s dime) to attend the BC Municipal Climate Leadership Council quarterly meeting, and the Minister’s breakfast that is hosted by that Council (of which I am a member). It was a productive meeting, and we were able to discuss the BCMCLC’s response to the Province’s Clean Growth Intentions Paper, which was both supportive of the work the province wants to do, and suggestive of some further steps the province could take to support local governments in reaching the aggressive greenhouse gas reduction goals that are required to meet Canada’s Paris targets.

I then returned to Whistler on Wednesday (not on the City’s dime this time) to attend the Lower Mainland LGA meeting (I am a vice president) and to present the annual Community Energy Association awards to communities taking exceptional efforts to reduce their energy use and greenhouse gas emissions. In my role as Chair of the CEA, it was my honour to share the awarding duties with the Minister of Environment and Climate Change Strategy. I also had the opportunity to give one of the awards to the Mayor of Nelson for their Solar Garden project –and let her know that imitation is the sincerest form of flattery, demonstrated by New Westminster copying their model for our own Solar Garden project.

The good news coming out the UBCM is that some resolutions we sent to be debated were passed by the membership of UBCM. These were:

B-8: Alert Ready Emergency Alert System

… be it resolved that UBCM works with the Province of British Columbia to provide access to the Alert Ready (emergency alert) system to local governments in order to allow them to broadcast critical and potentially life threatening alerts to residents of their respective communities using the framework of the Alert Ready System.

B-54: Cannabis and Harmonizing Smoking Regulations

… be it resolved that UBCM urge the Provincial Government of British Columbia to extend the prescribed distance from a doorway, window, or air intake in which a person must not smoke tobacco, hold lighted tobacco, use an e-cigarette or hold an activated e-cigarette from 6 meters to 7.5 meters and prohibit smoking in all public parks by amending the Tobacco and Vapour Control Regulations and by ensuring the corresponding distances prescribed in the Cannabis Control and Licensing Regulations are the same.

And:
B-102: Updating the BC Motor Vehicle Act to Improve Safety for All Road Users

… be it resolved that the provincial government be requested to support modernization of the Motor Vehicle Act, addressing the recommendations in the Road Safety Law Reform Group of BC Position Paper entitled “Modernizing the BC Motor Vehicle Act” to enhance safety for all road users.

I have to admit, I’m pretty chuffed about that last one.

Bad Data

I never want to react to the Fraser Institute. The easy ad hominem attack is that they are the Canadian propaganda wing of Koch Brothers enterprises, and their attempts to shift public policy in Canada should raise concern, but the more substantive attack is that they produce terrible reports that would not earn a passing grade if they were handed in as an Economics 101 term paper. They are bad at data, so it is best if we ignore them.

Alas, I was asked by an intrepid local reporter to comment because the City of New Westminster is made to look fiscally irresponsible in their latest fresh-off-the-presses piece of decontextualized tripe, so I did a bit of a dive into the numbers. This turned into several hours of trying to reverse-math their numbers, because like the failing university economics students they resemble, they don’t actually provide raw data or point clearly to what their data sources are, instead providing derived numbers without the benefit of showing their calculations. They are bad at reporting data, and we should probably ignore them.

I dug around in the BC Government website they link to as a data source (this one), and after figuring out how they got all of the population for 2016 wrong (using projected estimates instead of readily-available Census data), I started to dig through the various tables and repeated calculations until I got results mimicking theirs. They primarily used “spending data” from this table, and “revenue data” from this table. But they clearly didn’t know (or didn’t care) that New Westminster’s data includes the financial reporting by our Electrical Utility. They are bad at interpreting the data they have, so it is best we just ignore them.

For context, New Westminster operates its own Electrical Utility. It has since before BC Hydro existed. We hold on to it because it is a great deal for the residents of New Westminster. Using 2016 numbers to be consistent with the Fraser Institute report (See Page 90 of this report for the utility’s 2017 numbers), our Electrical Utility sells about $45,000,000 worth of electricity to residents and businesses in the City, at the same rate (more or less) as those customers would pay BC Hydro if they were in another Municipality. It costs the utility about $33,000,000 to purchase that electricity from BC Hydro at bulk wholesale rates. About half of that difference goes into operating the utility (paying staff, buying wires and building substations) and the other half is paid to the City as a dividend. We are the only Municipality in the lower mainland that does this, so we are the only municipality that includes these numbers in their expenses and revenue tables. This is important context. The Fraser Institute is bad at context, which is why we would all be better off by ignoring them.

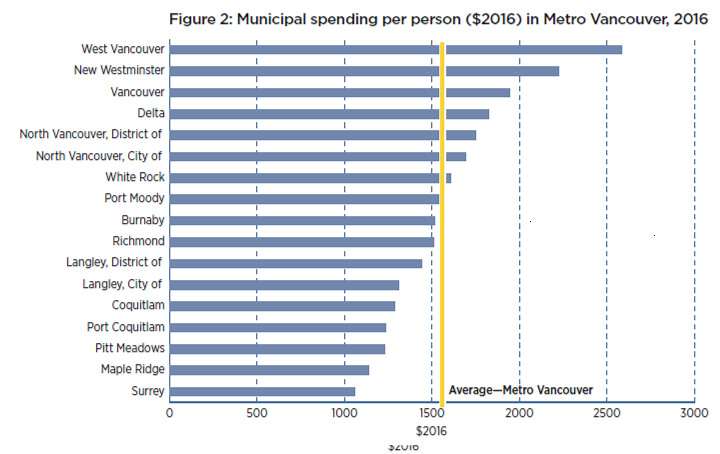
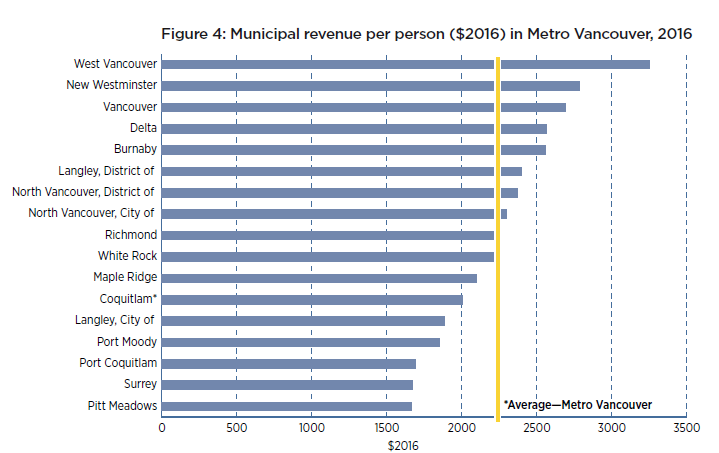
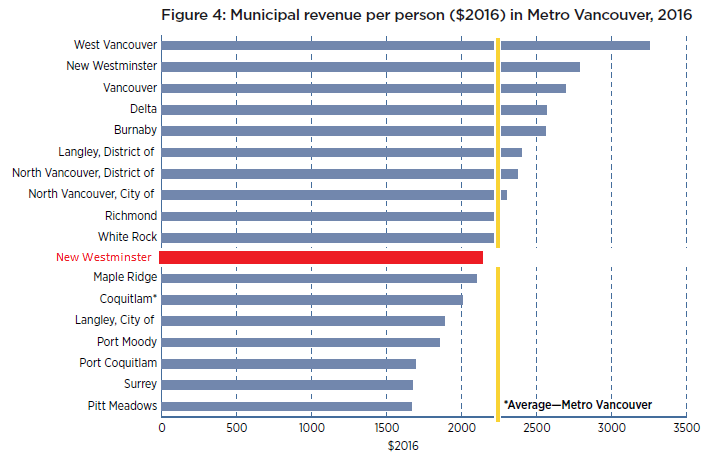
Because of this bug in the data, their report suggests that New Westminster has “the second highest municipal spending” per capita, along with “the second highest municipal revenue” per capita. They even have bar charts to prove it:

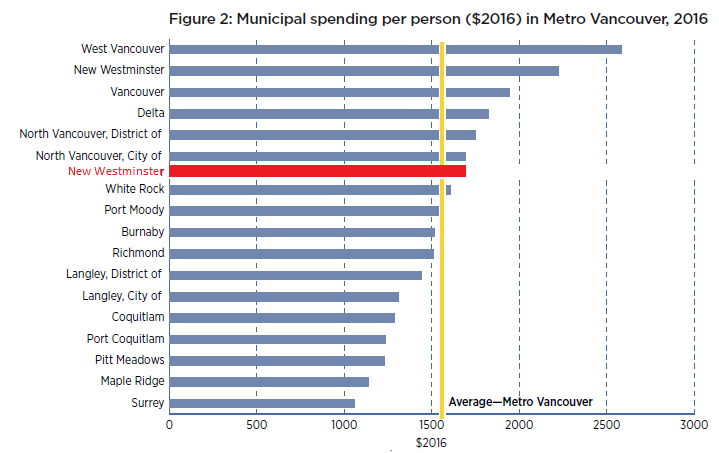
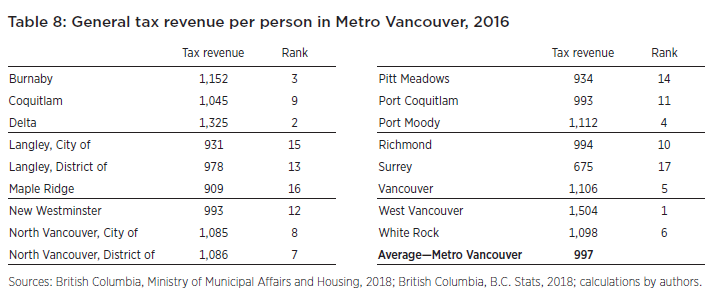
The problem being, New Westminster’s electrical utility “spends” about $38 Million a year, and it generates about $45 Million in revenue. If you take this into account, those bar charts look very different:

The shorter and more accurate story here is that New Westminster (outside of the electrical utility) spends slightly above the regional average on a per capita basis, and collects slightly less than the regional average in taxation and fee revenue. Think about that for a minute.

“Spending” in the local government context means putting police officers on the street, mowing lawns in our parks, and providing swimming lessons to your kids. The money we spend is providing services to our residents, and we do that at a slightly higher rate than the regional average. At the same time, the revenue we collect from our residents in the form of taxes and fees is lower than the regional average. An alternate Fraser Institute headline may be: New Westminster delivers more for less!

Ironically, part of the reason we deliver more for less is the electrical utility that can buy electricity for wholesale, sell it for retail, and provide a dividend to the City which we can use to provide services that would otherwise need to be paid for through taxes. Arguably, having an electrical utility is the most entrepreneurial thing we do, and is something that the entire “run government more like a business” Fraser Institute crowd would normally celebrate.

There is more in this report, including tables showing the City’s residential taxes are below average for the region (12th highest of 17 municipalities), and our debt servicing costs are average, but that kind of story – “City is about average” – doesn’t make for a very exciting headline.

Alas, New Westminster is just kind of average. And when it comes to managing finances, this is not a bad thing. Every financial decision is about balancing the cost with the priorities our residents and businesses expect us to address. I am proud of the level of service we provide in New Westminster, and our ability to do that while keeping taxes below the regional average.

TMH and the Public Hearing

We had a Public Hearing on Tuesday, and I have gnawed the ends off of a few metaphorical pencils thinking about how to write about it. Partly because it was an emotional night for a great many people, including members of Council. So I’ll start by talking about the facts, and save the emotions for after the fold.

The Public Hearing was to evaluate an OCP Amendment and Rezoning to permit the construction of a 44-unit supportive housing project on City land in Queensborough. This project is funded by the provincial government’s rapid response funding program, where capital and operational cost of a temporary modular housing (“TMH”) building will be covered by BCHousing, if a local government can provide land it owns (for a 10 year lease) and a reliable service agency agrees to operate the facility.

The City went through an extensive search for an appropriate site, and several sites were evaluated in Q’boro and other New West neighbourhoods. Of the three “short listed” sites, only the site at 838 Ewen Avenue was found to be viable. After some initial feedback from the community, we did some more evaluation of a second site in Queensborough, but again found it was not viable for reasons I discussed here. In short, if we wanted to take benefit of the rapid response funding, and have a TMH project in New Westminster, the Ewen Ave site is the only location.

Going into the Public Hearing, we received about 200 pieces of correspondence, and almost all of them were in favour. There was also an electronic petition circulated in the neighbourhood that opposed the project. The Design Panel, Advisory Planning Commission, and Community and Social Issues Committee all voted to support the project. I attended the public open house back on May 1, and heard concerns expressed by some residents, and also had some of my questions answered about the project. I had meetings with people who expressed specific concerns about the site, and the project in general, and also had many conversations with people who supported it, including many people who approached me at the Queensborough Children’s Festival two weeks ago. Along with other members of Council, I did a tour of the similar (but larger) TMH project in a residential Marpole neighbourhood that received significant public attention when it was proposed, but has been operating for more than four months without significant issues.

All this to say I had a *lot* of information going into the Public Hearing, but I was not sure what feedback we would receive, and only hoped for a rational and respectful conversation about concerns and benefits. In the end, we had about 80 people delegate to Council, with a majority in favour of the project. Even if we separate the presentations from the proponents (BCHousing and E.Fry), there were still as many community voices speaking in favour as opposed. That said, Public Hearings should not, in my opinion, be about raw counts of Pro vs. Con presenters, but should be about the weight of the arguments when seeking balance between benefits and costs of any project.

Fundamentally, this is a land use issue. The question before Council was whether this is an appropriate use of the land. This being the only piece of City land available does not by itself make it the right place for TMH. Every land use decision is about balancing positive and negative impacts, including opportunity costs. This lot was purchased by the City along with an adjacent piece of land a couple of years ago from the owners of the previous gas station on the site (demolished in 1991). It had recently been used as a construction staging and supply stockpile during the Ewen Avenue reconstruction, but is currently bare gravel. The location is close to the Queensborough Community Centre, adjacent to a bus stop with fairly regular service, and about 800m from major shopping. The service providers think the site is a good balance of being close to services but also in a residential area.

I am cognizant of the green space concerns, but do not see this project as a significant takeaway from Ryall Park. The lot is about 1,430 square metres, which is less than 2% of the Ryall Park area (when you include the Community Centre and adjacent playing fields, but not including the schools). Despite some comments I heard during the Public Hearing, Queensborough has more green space by area and per capita that the City’s average, made even more so with improvements over the last decade related to Port Royal Park, Old Schoolhouse Park, and greenway improvements along the waterfront. I am protective of the City’s green space, and agree that many neighbourhoods need more (which we are working on), but every discussion about green space is about balancing the opportunity costs and other community benefits.

A lot of the conversations and research over the last month has been around a “risk” argument – the argument that the residents of this housing will pose a greater risk to other park users than any other resident of a house or townhouse in the area. We met with BC Housing folks and reviewed the Community Advisory Committee and PAC minutes from the Marpole project and adjacent schools. We have talked to law enforcement and support agencies. We did everything we could to learn what the experiences in other locations were in relation to these concerns, talking to people who have dedicated their careers to providing assistance to people in need of housing. I could not find any evidence that this project will create some exceptional risk to neighbours or other park users. Quite the opposite, the evidence is ample that an amenity like this improves the lives of people in our community, and makes our entire community stronger.

Council each had their own reasons to support this project moving forward (and you can watch the video here, I don’t want to speak for others). For myself, I believe this is an appropriate location, the only location in New Westminster where this valuable amenity can be rapidly built, and I am convinced this project can and will be a positive for the entire community.


Now for the hard part.

This Public Hearing was soul-crushing. There is no other way to describe it. A week later, it is still causing me a mix of feelings, most of them negative. I cannot get over what was an overwhelmingly negative experience for every member of the public who attended – those in favour of the project, and those opposed. But I don’t know how we take a project that elicits so much emotion and provide outlets for people to speak from their hearts and their minds such that they feel heard or understood without the antagonism that was displayed. I believe in community consultation, and in representative democracy and responsible governance as a force for good… this was none of those, and I feel heartbroken about how the event unfolded.

One thing that was made crystal clear to me: the Public Hearing process is broken. This structure demanded by the Local Government Act is almost perfectly designed to create an 11th hour all-or-nothing us-vs-them divisive conflict event where opponents face off and speak past each other instead of providing a safe, inclusive, and collaborative conversation about the relative merits or costs of a project.

The structure is such that it makes it difficult for Council members (who must remain open minded through the process in order to act semi-judiciously in the ultimate decision making) to moderate the debate or pre-empt the conflict. Staff must balance on the razor’s edge of providing factual information about a project without appearing to be advocating for a project that must have had enough public policy merit to get as far as the Public Hearing. The delegates at any Public Hearing are almost exclusively people who feel strongly for the specific project, or are strongly opposed to it. This is evidenced by the fact that most Public Hearings are sparsely attended – you have to feel personally affronted to bother going out on a Monday night to speak at a boring public meeting. Of course, the stronger those feelings, the less likely one is going to accept or appreciate new data or varying opinions provided at the Public Hearing. And as it is always a last-minute winner-take-all debate, there is very little opportunity to learn, or discuss the larger policy implications that underlie a project, from affordable housing policy to transportation demand management to voluntary amenity contributions and urban design principles, because those are bureaucratic-sounding and technocratic solutions that are lost in the fog of parochial personal concerns and emotional battery. That is a terrible way to make decisions in a complex world.

I wish a week later I had suggestions, a model for a better way, but I don’t. I don’t know how to fix it. I don’t know how we have a more nuanced discussion with the general public about any new project that comes down the pike. I don’t know how we provide space for the somewhat-interested and potentially-benefiting to engage when so much of the space is taken up by the personally aggrieved. All I know is that the current model of the Public Hearing doesn’t work. As currently structured, it is an affront to representative democracy, a barrier to good decision making, and a terrible form of consultation. It divides at a time when we should be coming together. It needs to change.

Ask Pat: Elections?

Ed Sadowski asks—

When will we know if you will be running again in the upcoming municipal elections?

Yes, I am running for Council again. Sorry for the delay responding to you, but I did have to do a bit of serious thinking and also put a few things in place so that when I announce my intention to run again, people have a way to contact me and I don’t lose that initial campaign bump on that is (apparently) important.

If you want to read about my campaign, why I am running, what I want to do next term, and why I think you should vote for me, please go over to my campaign website (PJNewWest.ca). It is a little bare-bones right now, but I will be updating and improving it as the campaign goes on. One of my challenges with “launching” my re-election campaign is trying to figure out how I can keep this conversation – 8 years of blogging, hundreds of blog posts, its gotta be a million words by now – and keep it a little separate from the rhetoric necessary for campaigning. The election is in October, but I still have 4 months of work to do before then, so here is my strategy.

This website will pretty much stay the same, with blogs, updates on City stuff, random opinions on topics that interest me, and Ask Pats answered when I get a chance. My Campaign website will talk campaign, will have all of that campaign “why you should vote for me” stuff. My regular Facebook Page will be pretty much as it always was, and my Campaign Facebook Page will have campaign Facebook stuff like updates on where I am going to be, special campaign events, and probably a fair amount of campaign-related opinions. There is no way I am managing two Twitter accounts, or two Instagram accounts, so those are staying as is.

In the meantime, I’ll be out in the community as I have always been, ready to talk about the City and sharing ideas with the citizens of New West. It’s going to be a busy 4 months, but let’s take the time to talk.

LMLGA 2018 – Part 1

I’m out in Halifax at the annual meeting of the Federation of Canadian Municipalities, which is a nation-wide conference for local government types. However, I don’t want to report on this yet, because I still haven’t reported on my trip to Whistler last month for the LMLGA. Sorry, things have been busy!

The Lower Mainland Local Government Association is a networking and advocacy group that serves the local governments of the southwest corner of the mainland of BC, which I talk about a little more in my report on the 2017 meeting here.

The 2018 conference was at Whistler in the first week of May, and it was a full couple of days. Here is a quick run-down of what kept me busy over that time.

Pre-conference Sessions
There were two plenary workshops on Wednesday afternoon (I am on the LMLGA Executive, so I had to go up early for Wednesday morning executive meetings). One was on challenges that cities have in attracting and retaining family doctors, the second on the latest updates on cannabis legalization. I did not have a lot to say about the first session, as there was a lot of details about the problem (from how we teach Doctors to how we pay them and how we attract them from other jurisdictions – all firmly in the Provincial realm) and the solutions local governments could apply were a strange mix of making your city more livable and selling the benefits of your community to young professionals and their families.

The second session was more compelling, as there was a lot of new information about how other local governments are approaching legalization. There is a strict division between what the federal government and provincial government will be regulation, and there is a fairly well defined role for local government. As always, our role is land use (where will these businesses be able to set up?), business licensing (how will a local business operate –hours, signage, staffing, etc.), and nuisance management (where will we enforce smoking, growing, etc.). In New West, we expect to have a report back from Staff early in the summer to set up our local rules, though it seems obvious that the roll-out of federal regulations will be delayed from the July deadline set up by thr federal government.

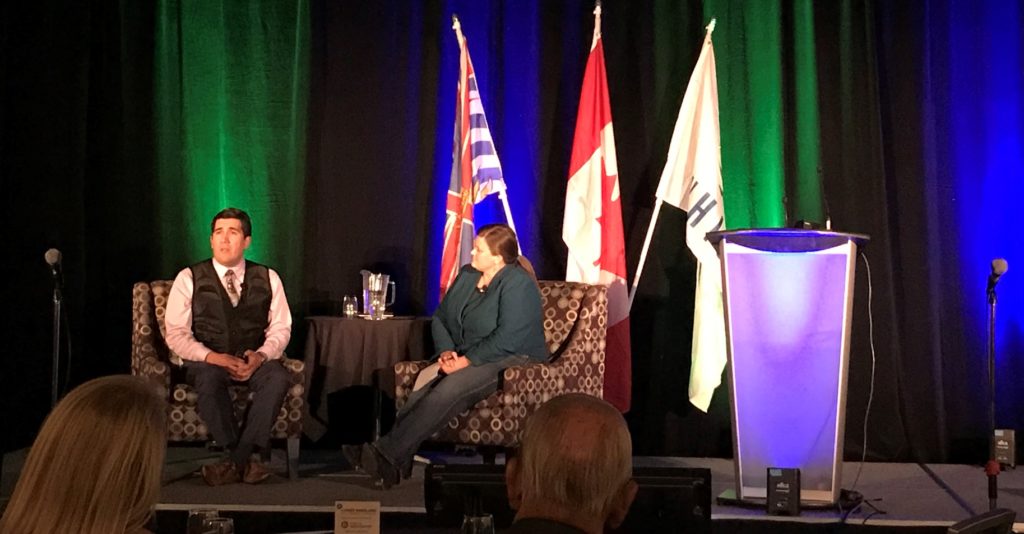
The opening day ended with a Keynote by Chris Syeta’xtn Lewis from the Squamish Nation, who gave a informative and poignant summary of the history of his people, and the context of where the amalgamated Squamish nations exist today, and what they see for the future of their region. A follow-up discussion with Mayor Patricia Heintztman of Squamish talked about the opportunities all Cities have for not just starting reconciliation, but finding a respectful space to have conversations about our shared future. It was an inspiring evening.

Day 1
Our Morning Plenary was a talk by author James Hoggan, whose discussed his book “I’m Right and You’re and Idiot”. It was a long dissertation on the current problem of public discourse (including there are too many people intentionally disrupting it for personal or political gain), and some techniques to address this (“speak the truth, but never to punish”). Any summary I give here will give short shift to his great multi-faceted talk that covered what Hoggan calls the “social pathology” of our natural predisposition to form teams, the opportunity to be found in embracing cognitive dissonance, and how all of us on every side of every issue think we are David and the other is Goliath.

I then ran a Transportation Connectivity session, which was in two parts. First, Don Lidstone gave a talk on the autonomous vehicle and vehicle-sharing future from the perspective of local government legal issues. Don is, among many I have heard on this topic, at the techno-optimist side of things, anticipating that our entire vehicle landscape will shift dramatically in the next decade to something we do not recognize. He switches quickly to pessimist, however, when he talks about how completely unprepared the province and local governments are. Nothing in our Motor Vehicle Act addresses driverless vehicles. The liability that falls on a Local Government if our infrastructure is not read correctly by an autonomous vehicle (say, if someone vandalizes a stop sign or road lines are buffed off) is uncertain and untested. There is also the not-minor problem that every local government has its own Street / Traffic / Parking Bylaws, and there is no system to an autonomous car to know this, or even any understanding of who is responsible for teaching a car that drives into New Westminster from, say, California, what a flashing yellow light means here or what the local parking restrictions are.

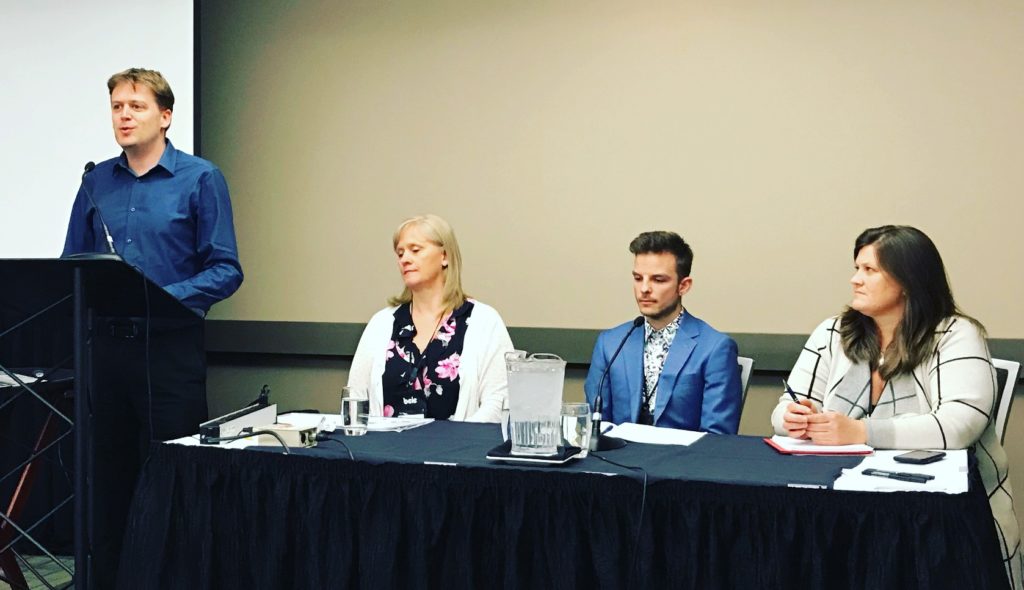
The second part was a panel discussion moderated by Mayor Cote, where a Planner from the City of Abbotsford, the Mayor of Squamish and a staffer from BC Transit discussed the opportunities and challenges of connecting the entire Lower Mainland (Hope to Delta to Pemberton) with Public Transit. Abbotsford and Squamish are both growing quickly, and both are becoming denser, more –transit oriented communities well served by Transit, but barriers exist between the area served by TransLink and those served by BC Transit. This is a bigger issue for Squamish, where up to 4,000 people a day commute to Vancouver, but Abbotsford is all about connecting local communities as opposed ot getting people to the “core”, as job growth is being pushed out to Abbotsford in a major way. So clearly, needs differ around the region, but the need for coordination does not.

We then had a unique program element: An actual honest-to-goodness debate. Seth Klein and Josh Gordon each had teams debating the question: “Does the Speculation Tax go far enough?”, which was fun to watch and quite informing about the strength of the tax as public policy (which resulted in the audience shifting somewhat from slightly in favour of the tax to slightly more in favour of the tax).

The rest of the Day 1 was spent doing AGM-type activities, including Bylaw updates, passing a budget, and electing officers for the upcoming year. You may now congratulate your new Lower Mainland LGA Second Vice President. Jason Lum of Chilliwack has been an excellent President for the last year, and Jack Crompton from Whistler will no doubt fill his shoes well, as he has already been a real driving force behind some of the new initiatives LMLGA has brought into assure it serves its members. We also had resolutions, which I will talk about in Part 2 of this report, which will be arriving soon…

MC Podcast!

A couple of years ago, a few new City Councillors from “the suburbs” of Metro Vancouver were invited to take part in a City Conversation at SFU, a program that brings people together over a brown-bag lunch at SFU Downtown to talk Urbanism. It was fun, and got us all speculating over a beer about how we can find an excuse to do this again. Then someone (I think it was Mathew Bond) said “Podcast”.

Two years later, almost to the date, we have a Podcast! It’s called Metro Conversations, and you can listen to the first 6 episodes at iTunes and GooglePlay. But first a little context.

Our initial idea was to repeat the City Conversations model: 1-hour conversations with a small panel of subject matter experts with an intimate audience, facilitated by the Council of Four (myself, Mathew Bond, Kiersten Duncan, and Nathan Pachal). We record these conversations, and put them out as Podcasts.

We also thought we could fill the space by also sitting down occasionally for a “Metro Chat”, where just the four of us discuss an Urbanism topic. The idea here is that we are elected people who are not subject matter experts, but can provide a bit of a bridge between experts and people interested in what goes into making a more livable city. We also bring context from our local parts of the region, as Urbanism too often emphasizes the urban centre and that is where it is more easily embraced. As we will explore, it is around the edges that the benefits and impacts of modern city-making are really felt.

As will be readily apparent to listeners, we are not professional broadcasters, but we are passionate about our communities, and love to talk about Urbanist topics and how they impact our communities.

We have a half-dozen episodes up and running, and a couple in the can that we are working on as far as making them audible. This is our first try (we could even call it “Season 1”?) and are hoping to hear form people about what they like, what we need to do better, or what topics you want us to tackle if and when a Season 2 is organized. So please tune in, and let us know what you think by going to our Facebook Page and providing us feedback.

There are People to Thank:

SFU Public Square for the grant and their (paid!) interns for doing a bunch of the busy work and coordination that we simply would never have completed if you left it to four City Councilors who live all over the place and have full time jobs and long lists of commitments that make our working together on anything difficult. This was only possible through the Public Square.

Michael Alexander from the City Program at SFU for pulling us together and giving us the inspiration to try something different.

Random #NewWest peeps Wes Kinna (for masterfully helping with sound at live events), Stephen O’Shea (for creating a cool distinctive sound for intro/outro), and Christa MacArthur (for lending us her distinctively non-distinctive accent).

The Network Hub in New West, the District of North Vancouver, City of Langley, City of Port Coquitlam, and City of New Westminster for hosting spaces for us to hold conversations.

And all of our guests and audience members who made the live conversations work.

Pipelined

I wanted to comment a bit on this story. Kinder Morgan is apparently using an industrial lot in the Braid Industrial Area of New Westminster for staging and equipment storage as part of the Trans Mountain Pipeline Extension Project. That has caused some people to send me correspondence around why the City is allowing this, people asking me why I am not opposing the pipeline. I replied to a Facebook Post, but I think this issue is important enough for me to expand a bit on it here on my blog.

The site within New West being used by Kinder Morgan is on Port of Vancouver land, not land where the City has any jurisdiction. Council members were very recently made aware this was happening, but we do not have any regulatory authority around land use on Port lands, as only the Federal Government can issue or withhold those permits. We were not involved in the planning for this, and we have not had any formal correspondence on the issue from the proponent or the Port.

This City and this Council have been involved in the NEB review of the Kinder Morgan pipeline from the onset. The City acted as an intervenor in the NEB review, raised a number of significant concerns during the process, and continues to emphasize these concerns since. Not the least of these concerns is the potential for impacts on the Brunette River and its riparian areas.

We have supported court cases challenging this project and the process towards its approval. The NEB and the Federal Governments (past and present) have demonstrated no interest in our position, nor do I feel they have adequately addressed our concerns. It is actually worse than that, as there were recent hearings in Burnaby to review some of the still-unresolved questions about the routing of the new pipeline along New Westminster’s border (and within the Brunette River riparian zone) and the NEB didn’t even invite New Westminster to attend. I was refused entry to the hearings when I showed up. They were held behind closed doors, and as the routing was some 30m outside of our City, my being able to even listen to the conversation was not seen as relevant. At least the Harper Government invited us into the room to be ignored.

I cannot speak for all of Council, nor is this the “official position” of the City, but I have been involved in this process for several years now. I bring a significant amount of professional and technical experience to this, having provided expert evidence as an Environmental Scientist to several Environmental Assessments in my career. I am concerned about the pipeline, but I am much, much more angry about the unaccountable and unacceptable process that has taken us to this point. In the last Federal election we were promised that the industry-focused reviews brought in by the Harper Government would be replaced; that didn’t happen. We were told that community consultations would be opened up, and that consent from communities would be sought; that didn’t happen. We were told that a new era of reconciliation would be ushered in before we impose unsustainable and  damaging infrastructure projects to unceded lands; that didn’t happen. We were told that subsidies to sunset oil industrial development would end and a new energy vision would be offered; that didn’t happen.

We were lied to, and now we are ignored.