Price Talk

I was fortunate to be able to attend the taping of a Price Talks podcast. It was a real transportation policy geek fest (and, alas, a real sausage fest). Jarrett Walker is a transit planning consultant, an author, and an academic with an incredibly cosmopolitan view of urban transportation systems. He has worked on 4 continents, and can see the universal truths expressed in the great variety of built forms in cities around the world. The conversation was wide reaching, from Coriolanus to Elon Musk, from the inescapable geometric truths of urban transportation to aesthetic as a guiding principle in urban planning. There were dozens of quotable nuggets in the talk, some I will be chewing on for a long time as I think about how to apply them to my neighbourhood and community

My favourite nugget, however, was the 4-minute summary of ride hailing and its impact on communities. You can skip to 1:09 to hear this as part of the Q&A at the end of the evening, but to fully appreciate his answer, you need to hear his earlier discourses on the phenomenon of Elite Projection, and how it is the scourge of most North American transit planning.

Walker is much more profound on this topic than I can ever be, but the short definition of Elite Projection is the tendency for the most wealthiest and most influential minority in a population to think what is good or attractive to them is best for everyone. It exists throughout hierarchical decision-making, and once you open your eyes to it, it is everywhere. In urban transportation, it is manifest in Musk’s The Boring Company and in “cute streetcar stuck in traffic” approaches to urban transit world-wide. There may be a few local examples: here, here, or even here.

The heart of his argument about ride hailing is best summed up in this quote (based on his observed experience in American cities where it has rolled out):

…it has been a great way to draw out the worst aspects of elite projection, because people who can afford it have become addicted to it, [and] expect as a matter of course that it will be available… [but] like anything to do with cars, it only works as long as not many people use it.

Part of the problem is that providing mass transportation in an urban area is not a profitable business. It never has been, and never will be. Uber and Lyft are losing billions of dollars a year, their underpants-gnome business plans being propped up by venture capital silliness, while they can’t even pay living wages or provide basic workplace protections to the people doing the labour (we aren’t allowed to call them “employees”). At the same time, they cut into public transit revenues while increasing traffic congestion making those transit systems less reliable, pushing customers over to the ride-hailing industry, exacerbating the impacts. He doesn’t even touch on how ride hailing demonstrably correlates with less safe roads for people in cars, pedestrians and cyclists, but he doesn’t need to.

The warning for Vancouver is that the introduction of ride hailing could be “really terrible” for our traffic systems and our livability, for obvious reasons. The promise of ride hailing is that it reduces parking demand by increasing traffic congestion – this is not conjecture, but the demonstrated experience around North America. That is no win at all.

For you Uber fans out there, Walker does provide a clear policy recommendation about how we can make ride hailing work in our jurisdiction without externalizing these real impacts, but I guarantee Francesco Aquilini and Andrew Wilkinson ain’t going to like it…

Give it a listen, it is a great conversation:

A Night with Jarrett Walker: Building Human Transit with Shakespeare, String & Elephants in Wine Glasses

Active Transportation

I know I haven’t blogged about this week’s Council meeting yet, I haven’t had time to edit and get the post up. It’s coming, I swear. In the meantime, I want to get this out, because it has been in my outbox for a little while and it has suddenly become time sensitive.

The Provincial Government is asking the public about active transportation. I have been known to criticize the Ministry of Transportation in the past about their approach to “cycling infrastructure”, but I am going to hope that this is the start of a new approach. You have until Monday to answer their questions!

If you are too busy to write your own thing, you can go to HUB and fill in their form letter, but as an elected person, I like to receive input that brings something new – a 1000-person petition is not as powerful as 100 personal letters that each bring different nuance. So I encourage you to take a few minutes and fill in the answers yourself. If you want some inspiration, here are my answers I will submit this weekend:

Question 1: What does active transportation mean to you and how does it fit into your life?
Active transportation means healthier, safer, happier communities where youth are safe to ride a bike to school and the elderly are comfortable walking to the grocery store. It is about replacing fossil fuel dependence with transportation independence. When we build the infrastructure to support active transportation, we give more people the freedom of choice in how they move around their community, reduce their reliance on volatile international oil markets, keep more of their money in the local economy, build resiliency in our communities and connections between neighbors.

Question 2: What are some of the challenges in your every day life that prevent you from moving towards using active transportation modes? What are some of your concerns about active transportation?
As an active transportation user, and a local government decision maker, the biggest challenge I face is addressing the “gaps” in our systems that make active transportation less safe and less comfortable. I am lucky to live in a compact, dense community where most services are a short walk or bike ride away, but so many of my neighbours still feel it is unsafe to make the journey unless surrounded by two tonnes of steel, which in turn reduces the perceived safety for other community members.

Too much of our active transportation infrastructure is developed as baubles attached to the side of new automobile infrastructure. Sidewalks, crosswalks, overpasses, cycling lanes, and transit supports are evaluated in how they support or hinder adequate “Levels of Service” for automobiles, while the high LOS goals (fast, uninterrupted vehicle travel) acts to make active transportation space less safe and less comfortable. An overpass over a busy road is seen as a pedestrian amenity, when it actually serves to provide more space for automobiles to have unrestricted travel. The trade-off is usually a longer more difficult journey for a pedestrian and introduction of a new barrier for people with mobility challenges. We need to see active transportation alternatives as a solution to community livability, not as a hindrance to the flow of traffic.

Even the language of “transportation” vs. “active transportation” reinforces the idea that using your feet and your own body to move around is somehow lesser than – a secondary consideration to – using an automobile. I have to explain to people that I use transit to get to work, I use a bike to run errands, I walk to City Hall, like that is some sort of radical action instead of a rational and normal way for a person to live in on a modern urban city. Let’s switch that default, for the good of our communities, the good of our budgets, and the good of our planet.

Question 3: What is the most important action that government could take to promote active transportation? What is unique in your community or region that needs to be considered?
Of course, funding. Local governments are straining to provide services as our infrastructure ages. We receive 8% of the tax revenue in Canada, yet own more than 50% of the infrastructure. This inequity is sharpest when it comes to transportation infrastructure. Billions flow for highways and bridges that direct automobiles into our communities (with, admittedly, the requisite active transportation baubles attached), but the local improvements to help us move around within our communities are tied to expectations about “Level of Service” for those automobiles. The cycle is vicious.

My community has one of the highest active transportation mode shares in the province. New Westminster is a transit city, it is an easy city to walk in and the revolution in electric assist bicycles means that residents no longer need to be athletes to manage our hills. We have some of the lowest car ownership rates in Canada. This is not an accident, the City has a dense urban fabric that puts most services near where people live, we are concentrating our growth around these transit hubs and working to make our pedestrian spaces safer and fully accessible. Yet we are choked by through-traffic that makes all of our active transportation spaces less safe and comfortable. This load means we need to spend millions of dollars every year in maintaining our asphalt to provide the level of service through-traffic expects, while struggling to find the thousands of dollars to build better cycling, pedestrian, and transit-supporting infrastructure.

We need help making our transportation system work better for our community, but as long as that transportation funding is tied to our ability to get cars moving, to provide high automobile “levels of service”, we are putting out fires with gasoline.

Ask Pat: Omnibus edition!

I had a few Ask Pat questions in the queue, and it being Family Day Long Weekend and all, I figured I would answer them all in one fell swoop. Have a question about the City, Council, Politics, music or fashion? Hit the red button up there to the right and send it to me, and more likely than not will answer it, hopefully before you forgot you even asked it!

RK asked—

I was in Winnipeg this last Christmas for a few days, and when I visited the public market at The Forks, I saw they had craft beer/wine stall set up in the main food court area, where people could buy a drink (served in glassware) and then enjoy it at any of the tables in the market, not just a roped-off area. Are you aware if there are legal restrictions on such a business opening in the River Market? It seems like a great and space-efficient way to not only add more life to a market but also complement the existing food-service businesses. And perhaps it was just the time of day that I was there, but I didn’t notice any roaming gangs of drunkards smashing up the place or terrorizing young children.

I’m not one to speak for the River Market. They are a private business with a business model that works for them. They have been pretty successful at activating the Market Hall, and I have enjoyed many, many events there over the last few years. It is also one of our community’s great “Third Spaces” where you never know who you will meet or the conversation you are going to have when you get there.

I also may not be completely up to date on the changes to BC liquor laws as they pertain to public spaces, but I think the Market would probably be able to license the common spaces as you suggest. However, this would very likely limit their flexibility in how they operate the space, and strange things like security measures and temporary license suspensions to accommodate special events would probably be more hassle than it is worth. The owners and operators of the Market are pretty entrepreneurial and creative, so the best evidence I have that the inherent hassles make it not worth doing is the fact they are currently not doing it.

That said, have you been to Fridays on Front? There was even a Christmas Edition under the Parkade this year. There were shifts in provincial liquor laws that allowed this to happen, and it took a bit of vision to put New West at the leading edge of activating those changes. I think the Downtown BIA (with some support from the City) has done a great job demonstrating that public market spaces can have an open license for adult beverages available without chaos ensuing. I’m old enough to remember the craziness that used to come with public drinking in BC in decades past, and the cost of managing that craziness made some great events go away (I’m looking at you Seafest Vancouver Seafest, Pentiction Peachfest, White Rock Sandcastle festival). I think the attitude around beer and wine have changed as our society has matured, though the transition away from puritan prohibition-era liquor controls is a slow one.

And as of the leading edge of current regulation, there are no special event licenses envisioned for cannabis, but I’ll hold that conversation off for a future post.


JJ asks—

are you the person that sides with justin trudeau of political correctness? Jaywalking the word to be remove? Stop the left wing removement!

[Sic] Dude, if you think Justin Trudeau represents some sort of left wing of Canadian politics, we are not conversing from the same frame of reference. My disappointment in his election in 2015 was very much tempered by the knowledge that Harper was headed for a long-overdue trip to the political wilderness, but I was also disappointed that Mulcair decided to tack towards the centre and got “out lefted” by Trudeau on the campaign trail (though that was not the only NDP campaign mistake last election). Clearly people were ready to move left politically, and voted for progressive ideas like legalization of cannabis (done), electoral reform (shamefully abandoned), and feminism (the jury is out on this one). Predictably, Trudeau swung right after the election and abandoned many of the most left-progressive ideas upon which he campaigned, from climate action to reconciliation, and his record is almost indistinguishable from Harper’s Conservatives on these files. Gord Downie would be disappointed. I am becoming less and less of a Trudeau fan as time goes on, and look forward to calling him out on his failures in October, but I will not make the mistake of looking for him to my left.


FB asked—

If i find someone isn’t sorting garbage and i take a picture as proof is it violating his personal information or privacy?

I’m not a lawyer, and know better than to give legal advice. If you have a problem with how someone is managing their waste stream , and suspect that they are contaminating the recycleables or compostables, there is good reason for you to take action, because this type of contamination costs the City money, or your Strata potentially lots of money, depending on how your waste is managed. I might suggest that friendly attempts at education might get you further than surreptitious incrimination. They may just not know better, as the rules for waste sorting are sometimes complicated and constantly shifting.

If this is going into the City’s waste stream, you can contact our Engineering Operations folks at 604-526-4691 or engops@newwestcity.ca. If you are in a Strata or a rental, please let your building manager know and ask them to take action. It is their job, and they will save money in the long run if they have a well-organized waste stream that assures as much waste as possible is diverted from the landfill.


Jenni asks—

How do I find out information about previous renovations done to my home before I purchased it? The previous owner simply said that all of the work was done before they purchased the home. Is there an archive of building or renovation permits that I can search?

Hey, I actually know the answer to this one! The City has an online tool where you can search for all kind of details about the property you own, or snoop on your neighbor if that is more your thing, because permits are public information, and the City has a pretty open approach to sharing data that belongs to the public.

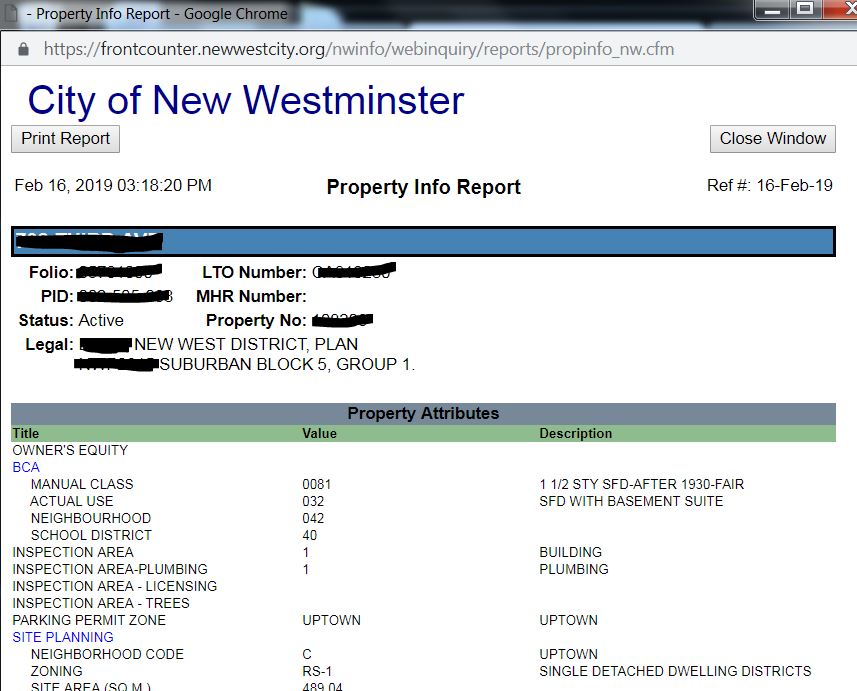
If you go to the City’s website, and look for “Property Inquiry” under the Online Tools section, you get a slightly-ugly but super-functional interface that allows you to get an online report that tells you all sorts of info about your property. For the fun of it, I searched for my house and found a bounty of info about my lot size, the amount of tax I pay, and even that the Business License for my consulting hussle is up to date (redacted a bit to make it one step harder for stalkers to find out where I live):

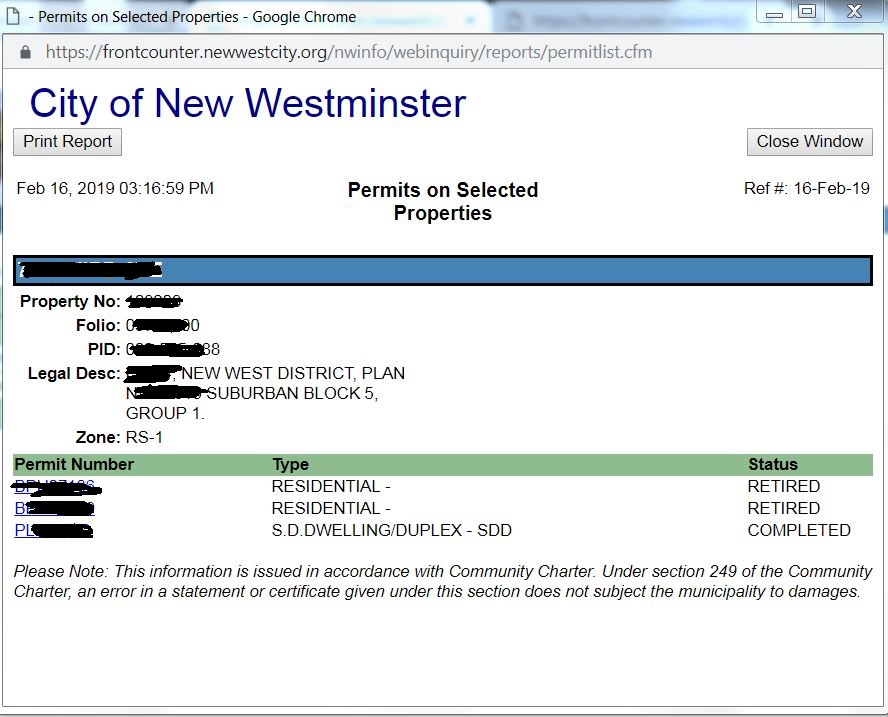
You can also get a list of all the permits for the property:
Here I can see three permit numbers: the original building permit was from 1940, my rear sundeck was built in 1987 with a valid permit, and I can see the permit I took out for my bathroom renovation project I did two years ago.
Of course, there are no permits there for the renovation of my basement that probably happened in the 1980s, or of the attic conversion that happened around the same time, or of the transition my house clearly went from knob-and-tube electrical to modern insulated wiring. It is possible that permits were not required, or the owner at the time didn’t get a permit, or the City has lost the records. This just to say that the City knows what the City knows, and you should not assume the data you get from these searches is a definitive record of the work done in your house.

How I’m voting on how we vote

Finishing up my own electoral stuff, it is time to move on to the referendum. It seems just yesterday that I was stumping for a Yes vote on a referendum plebiscite from my City Council bully pulpit – how did that one work out?

Nonetheless, I was asked about the Electoral System Referendum a few times during the election and I told people I didn’t want to get distracted while involved in my own campaign, but I would write something about it when the ballots come out. A ballot package is currently sitting on my counter, so here we go.

I am voting for proportional representation (PR) over first past the post (FPTP). The reasons for this are plentiful, and I have done a significant amount of research on this over the last few years, including during the aborted Trudeau campaign to change the federal electoral system. To keep this from expanding into a book-length blog, I am going to simplify a bit on a few key points.

The primary pro-FPTP argument that PR will bring extremists into power is a heaping pile of logical fallacy. In recent FPTP elections we have seen Doug Ford given 100% of the power to invoke the notwithstanding clause to punish his former City Council political enemies with only 40% of the vote. He says he was elected to cut taxes and slash public services when 60% of Ontario Voters voted for the exact opposite. Shortly after, the CAQ were given 100% of the power in Quebec to invoke the notwithstanding clause to pursue their anti-immigration and anti-free-expression campaign after garnering 38% of the vote. These are extremist views for Canada. A PR system may allow these voices into legislatures, but there is significantly less chance they would earn enough votes to achieve the power needed to shift policy towards those views.

Despite FPTP-supporter arguments, you will always have a locally-accountable MLA under any of the PR systems. Every system has you voting for a direct MLA representative as you do now, the difference is that all systems will give you at least one more second MLA who is also representing you. It is also likely this second MLA will be from a different party than your first MLA. Remember how during the Teacher’s Strike, all of those BC Liberal MLAs locked their office doors and refused to meet their constituents? Too often in an artificial FPTP majority, the job of that MLA is to represent the party’s interest to the community, not vice versa. When a government policy impacts your life negatively, it is important that you have someone in your community who can assure that your concern is carried to the legislature. PR provides this much better than FPTP.

Jurisdictions that use PR are more successful by almost any measure of good governance. There is a significant body of evidence from around the world about the results of different systems. Among OCED democracies, those that use some form of PR have consistently higher Human Development Index scores, have less income inequality, have stronger environmental regulation and are leading the world on addressing greenhouse gas reduction. The quality of life for their residents is higher and their electoral participation levels are higher. It is almost as if these two things go hand-in hand. This is why the PR argument is so much about “making your vote count” – it results in governments adopting policies that appeal to a broader range of voters. Who could possibly be against that?

These arguments aside, I was caused to step back and look at this situation in a different way a few months ago when I was chatting with MLA Bowinn Ma on a SkyTrain trip. Memory being what it is and she being much more nuanced and eloquent than I, we can call this a paraphrase. She pointed out that every argument for FPTP was about who would take power after the election, while every argument for PR was about how we can make more votes count. This is a simple but profound difference in vision for what we are trying to achieve through democracy. I believe the latter is a better, more hopeful vision, which is probably why I find their arguments more compelling. I hope this referendum will give us an opportunity to reach for that better vision.

The second question asks which of the three proposed PR systems I would prefer. Here is where it gets tougher. I am going to list in order of my preference, but recognize that no one system is perfect (but none are as imperfect as the current FPTP system).

Mixed Member Proportional – This is the most tried-and-true proportional representation system. In BC, it would mean our ridings would grow a little in size, and every riding would have an MLA elected by FPTP like they are today. However, ridings would be clumped together into small regions of several ridings that would have regional MLAs. You would be able to vote on that regional representatives, but the persons serving that role would not be elected by straight FPTP, but allocated to make party representation across the province match that of the overall vote. The ballot can be simple, the change in our ridings is minor, and PR is achieved. This wins in the balancing simple and easy to understand while also giving you an opportunity to vote for a great local candidate who may not be with the party of the Premier you want to see elected.

Dual Member Proportional– This is a system modified for Canada, where most ridings are merged into two ridings, with on MLA elected on the current FPTP system, and a second appointed based on electoral results in order to balance party representation across the province. This seems to be intended to simplify the ballot (you only vote once), but otherwise has no advantages I can find over MMP. You lose the ability to vote for Party A but an outstanding local candidate for Party B like you get from MMP – in other words, this forces you to choose a great local rep OR a party affiliation, but not necessarily both.

Rural-Urban Proportional– This hybrid system mixes Single Transferable Vote for the “urban” parts of BC, expanding ridings to 4-7 MLAs and a ranked ballot to allow you to vote for as many or as few as you might like, and a Mixed Member Proportional system (top) for rural ridings. I can see where this idea appears – it provides sophisticated urban political nerds like me an appealing ranked ballot, but also assures the rural ridings of the province won’t feel like they are losing their disproportional representation in Victoria. I dislike it for both of those reasons, and it being the most complicated system, I don’t think it will really be embraced by the voting public.

So put me down for Yes and MMP. I honestly would be happier with any of the three options than I am with FPTP, so the second question is really rather…uh… secondary. But please fill it out, because it is fun to fill our ranked ballots, and because I want to do everything I can to support the government having the political will to make this change.

#NWELXN18 – a wrap

I have gone through the numbers of the recent election in a couple of posts, (here, here, and here) but I did so recognizing that I was perpetuating a trope that plagues democracy in North America (and perhaps the world?) – looking at politics like it is just another a sport. Line scores and a zero-sum-game of winners and losers are the easiest and laziest way to report on elections. It leaves little room for the more important discussions we should be having during an election: the debate of ideas and values and visions for the future.

I need to say that this has been a difficult blog post to write. There are a couple of 1,500-word drafts that have been deleted, because they all fell into the mode of being an us-vs-them analysis, and were more critical than helpful. I spent most of the last three months biting my (digital) tongue and not reacting to the messages of those who would have rather they be elected than me, because I wanted to avoid being drawn into a useless spat everyone would regret. It would serve no purpose (other than a little personal catharsis) to go there now.

**That said, I feel the need to stick one of my regular caveats here where I say all of this is my opinion, not the opinion of my council or election colleagues, City Council, the City, or any rational person or organization. If you disagree with me, let me know!**

This slipped once during the campaign when I made a reference to Daniel Fontaine, in reaction to a pretty ham-fisted attempt on his part to demean me on his blog, using what I think was an appropriate amount of dismissive humour, but then following to point out how disingenuous the hit piece was:

Trust me, the hardest part for me this election was not reacting to opponents on-line. There were many drafted-then-deleted tweets. Maybe I’m growing up.

But what was this election about? Other cities had clear narratives (Surrey wanted someone to deal with crime, Burnaby was about the need for housing, Port Moody about slowing the pace of development), but what was the New Westminster election theme?

After the fact and looking at the numbers, it is easiest for me to take the message that voters are generally happy with the way the City is being run, and were not as interested in change as in some of our surrounding communities. This reflected what I heard on the doorstep during three months of doorknocking, and what I heard in a thousand small conversations I had during the election. Things are not perfect, there are definitely things we could do better, but for the most part, things are headed in the right direction, and few are interested in a big shift in direction.

In the end, our main opponents must have heard that as well, and were challenged with messaging “things are mostly OK” along with the “time for a change” idea. In the end, they fell back on the familiar and tired narrative that New Westminster is run by organized labour in a poorly-defined but somehow nefarious way. This is the same narrative that James Crosty used to no success in New West for several elections, and the old Voice New West relied upon. Like running against bike lanes in Vancouver, this campaign message is exciting to a group of people in the City and gets amplified every election by the local media, but has never been one to motivate voters to come out and create a change. New Westminster happily votes for Labour-affiliated and NDP-affiliated candidates enough to elect them, and have done so in increasing numbers in every election for the last decade or two. This is why orange signs were a cynically good idea.

To the credit of my colleagues and voters, the winning candidates never stopped talking about the important issues to New Westminster – housing, transportation, inclusion and accessibility in schools, and livability of our community. They also worked hard to knock on doors and meet people. When I look at the new names at the top of the polls – Nakagawa, Ansari, Beattie, Dhaliwal – these are the candidates I saw out there every day earning votes with shoeleather and ideas. On election-period effort alone they earned every vote they got.

There was one big difference between this election and the previous one – the remarkable shrinking of the media space. Last election there were four (4!) local newspapers a week in New Westminster, now there is one. At the risk of poking those who buy ink by the barrel, there was not a tonne of coverage in the last few weeks of the election in the lone paper standing.

Since Labour Day (when the public starts properly paying attention to the campaign), there were a few news stories that announced the new candidates as they trickled out, a couple of pieces covering NWP messaging around how unfair the entire election process was, and not a lot else. The two substantial pieces were an October 4th quote-mining review of two All-Candidates Meetings (which strangely emphasized May Day as the biggest issue), and a really excellent 2-page spread on October 11th on diversity. However, through the entire election period there were no printed candidate profiles, not a single article discussing housing policy, infrastructure needs, transportation challenges, or any of the other top issues that might have informed voters about contrasts between what different candidates were offering. The final edition before the election (October 18th) had a single opinion piece admonishing people to vote, but no other coverage of the election or issues at hand. I don’t remember being asked a single election-related question by a single reporter between Labour Day and the close of the polls.

I recognize there are limited resources and limited column inches in one edition a week, and there was more material available on-line, but even that discussion was dominated by discussing the process of the election, with paltry discussion of policy issues. The emphasis on click-baity open-question headlines on Twitter and Facebook probably just worsened partisan bickering between supporters instead of actually inform on any issue. Indeed, here is where I missed the old Tomkinson-era Tenth to the Fraser that provided a really strong and well-curated online discussion. I suspect print is still more important to a significant number of voters than on-line content, and I can’t help but feel that the Burnaby Now side of the local Black Press Glacier Media office got a lot more attention, and their election got more column inches. Perhaps their election was more exciting.

So what now? The things I tried to talk about during the election are still my priorities after the election. We need to continue to improve how the City communicates and engages the public, and I want to have a serious talk with the provincial government on reforming the Public Hearing process. We are already leading the region in affordable housing policy, but have no intention of taking our foot off the gas, and will work to get new funding and new policy levers provided by the province (such as Rental Zoning) working for us locally. On transportation, I want to push a conversation forward about changing the culture in our roads. I want us to prioritize making vulnerable road users feel safe at all times. It is time for us to grow up and talk honestly about the goals of our transportation plan, which is not the destructive (and ultimately self-defeating) goal of “getting traffic moving”. 

Of course, I am just one of 7 on Council, and finding consensus on strategic plans for the next 4 years will be the main conversation for the next couple of months. Stay tuned!

#NWelxn18 – poll-by-poll

The final election results are out, with poll-by-poll results. This gives us an opportunity to infer a bunch of things about the election. Note that this is more like reading tea leaves than defensible analysis, because anyone in the City can vote anywhere during a local election. We don’t know if the typical Queens Park Voter cast their vote at the Armoury, Glenbrook Middle School, or in an advance poll at the Lawn Bowling Club or City Hall. It is somewhat safer to assume mostly Queensborough voters voted in Queensborough, and the Pensioners’ Hall probably captured most of lower Sapperton, but where did Downtowners vote? There is a lot of fuzziness here, but here is a poll map:

Messy data doesn’t prevent me (or some other local blogger) from trying to glean insight from it.

This table shows the poll-by-poll vote for City Council. I marked the winner of each poll in dark green, the second place in medium green, and the rest of the top 6 in light green. Orange is for the 4 people who finished just below the threshold:

No surprise here that overall winner Nadine Nakagawa won the most polls with 13 – she not only won the popular vote, she won the Electoral College! She was also the only candidate to “place” (finish in the top 6) in all 20 polls. She dominated. Mary Trentadue and Daniel Fontaine each won two polls, with myself, Jaimie McEvoy and Chuck Puchmayr each winning a single poll. I had far and away the most second place polls, and all of those elected “placed” in between 18 and 20 of the 20 polls.

Team Cote candidates dominated almost every poll, except in Queensborough, and (arguably) Howay – the poll used mostly by Massey Victory Heights residents – where the New West Progressives (NWP) had a solid showing.

People paying attention to the campaign will have noticed that the NWP put a lot of effort into Queensborough, stoking some discontent around a few long-standing neighbourhood grievances, and benefiting from support of a small but vocal group of Temporary Modular Housing opponents. Team Cote members also did a lot of work in Queensborough (I personally knocked on hundreds of doors there), though we can look back now and say that the ~200 vote gap between the best NWP candidate and worst Team Cote candidate in that neighbourhood was hardly a factor in the overall election result.

For the fun of it, I looked at what percentage of their total vote each candidate received in the advance and special polls:

Interesting that Team Cote candidates received between 21% and 22% of our votes in the advance polls, NWPs around 20%, and others under 20%. I’m not sure if this relates to the relative get-out-the-advance-vote efforts, but it seems a consistent trend.

School Board data looks a lot like Council results, though perhaps a little more diffuse:

Overall winner Anita Ansari won 11 poll of the 20 polls, with Dee Beattie winning three and returning champions Mark Gifford and Mary Lalji each winning two. Queensborough resident Gurveen Dhaliwal won both polls in that neighbourhood. Beattie was second in most of the polls she didn’t win. NWP candidate Danielle Connelly didn’t win any polls outright, but did finish 2nd in three of them. Ansari was the only candidate to place in the top 7 in all polls, although Beattie only missed one (the Q’boro advance poll) as did Connelly (the Special Poll for hospitalized voters). Also note that the Team Cote candidates finished in alphabetical order – likely a coincidence, but fun to speculate about.

Mirroring the Council result, the NWP candidates did better in Queensborough than any other polling station, but also clearly had good success at the FW Howey poll in Massey Victory Heights, along with Mary Lalji. The standout among the others was Alejandro Diaz, whose success seemed to track along with Team Cote success better than the NWP, suggesting he was the most popular “6th vote” for those who voted the Team Cote ticket, where Lalji had stronger results where Team Cote did less well. Again, the Advance vote percentage closely mirrors that of Council:

I’m not going to say to much about the Mayor’s race, because it was a blowout by pretty much any measure. Cote finished with less than 70% of the vote only in two polls (Queensborough and Howey), and won more than 80% in his own neighbourhood. Nikki Binns was clearly the second most popular candidate:

Outside of the statistical analysis, I am struggling to write a piece about “what it all means”. As someone who did well in the election, I don’t want to be seen as punching down in my analysis of why others didn’t do well. I have had a lot of conversations with different people since the election, and have heard a lot of opinions about the result. I am tempted read into New Westminster bucking the general regional trend of this being a “change election”, as seen in Port Moody, Vancouver, and Burnaby as a testament to the good work this Council has done, but getting out of my bubble a bit on this will be a challenge.

Bonus chart: Since I mention the quirk of the alphabet order of the top 5 in the School Board election, I thought I would do a quick scatter chart of election results and order the names appear on the ballot. Blue is Council and red is School Board (with best fit lines and R² provided by Excel):

The Council result is close enough to random to be considered so, but you could convince me there is something going on here with the School Board ballot…

#NWELXN18 – THE TRENDS

One of the discussions during this election (and in all local elections for the last few decades) was voter turnout. Already low across the region, there was some concern that this election would see even lower than usual turnout. We don’t have official numbers yet, but I thought it would be good to compare this year to previous years.

There was some reason to suspect lower turnout this year. As charming and important as School Trustees and City Councillors are, it is really difficult for normal people and occasional voters to connect with that level of government. Occasionally, we have a candidate who is really compelling (I think of Jonina Campbell in 2011, Kelly Slade-Kerr in 2014) who drive some increased interest, but I doubt even that draws more than a couple of percent of eligible voters. Much like federal election interest is driven by the candidates for Prime Minister (sorry, Peter), the reality is that local elections often carry the weight of the Mayor’s race. And the reality is we didn’t have much of a Mayor’s race this year. Nothing against the challengers, but they all started very late and had limited campaigns (only one had lawn signs, one other had a website, and attendance at all-candidate events was spotty). I think in most people’s minds, even those who opposed him, Cote as a safe bet to win.

However, there was also a reason to suspect turnout may be higher, and that was a well-coordinated and -funded party running in opposition to the existing Mayor and Council. There is good potential for a party with strong political connections and good messaging to drive turnout, both by their own efforts, and by forcing the incumbents to get off their duffs and work to keep their jobs. I knocked on almost as many doors this year as I did in my rookie year, and direct voter engagement – actually looking at people and telling them to vote – is the proven Get Out The Vote strategy.

So how did that all work out?

A note here, I am using the unofficial voter stats released by the City for 2018, and the City’s open data number for previous elections (we don’t yet have official numbers for 2018). I am also using population stats from the BC Government website. These numbers are not “voter turnout” in any official way. New Westminster’s population is about 74,000 people. We had just under 50,000 registered voters going into the election, though some of those people may have died, moved out of the city, or otherwise not been eligible to vote this election. There were probably a fair number of people who were eligible to vote but were not registered to do so, and registered on the day of the election. Short story: numbers are complicated, and everything below is an estimate.

This graph shows the number of votes for Mayor, Council, and School Board for every election since 1990 (the first year these stats are provided by the City), alongside the population trend for the same period:

As the numbers are hard to compare on a single y-axis, I indexed all of them by dividing all of the numbers by their 1990 value to allow a closer comparison. Numbers below 1.0 are lower than the 1990 value, numbers above 1.0 are above the 1990 value:

Finally, to see how the vote numbers compare to population change, I divided the Mayor’s vote count by population, and the Council and School board votes by population *and* by dividing them by the total number of available votes (6 for school council, 7 for school board). See the above caveat about this not being “voter turnout”, but it does provide a clear indication of how voter number change when population change is removed:

In short, voter turnout dropped in the late 1990s, turned around in the early 2000’s, and took until 2014 for it to catch up to the losses of the previous decade. 2018 turnout is slightly down in 2018 for Mayor and Council, and slightly up for School Board when compared to 2014.

This does show the importance of the Mayors Race. In 1999, the Mayor was acclaimed, and the School Board and council vote turnout suffered. The 2002 Election was an exciting affair with Wayne Wright unseating the incumbent by 18 votes, resulting in a jump in voter turnout across the board. The next three elections were relatively lackluster as a popular mayor won fairly easily, and the Council and School Board vote more or less flat-lined. (the 2008 School Board jump possibly related to the Grimston Park school controversy? Or am I getting my dates mixed up?). 2014 was again an exciting mayoral race with a strong-campaigning challenger unseating a popular incumbent. And much as I would think I am responsible for the huge jump in Council votes that year, the turnout across the board (if not my lackluster 5th place finish) belies this hope.

One thing that does stand out is uptick in School Board votes this year while Mayoral and Council votes were slightly down (on a per-capita basis). I would love to hear a theory to explain this. Good candidates? The fact they are finally pouring concrete for a new High School? Or perhaps it was because no group ran a full slate, so there was seen to be more room for challengers to get onto the board? Enter your theory here.

Poll-by-poll results are yet to be released, and that is where the real fun is! I will write another piece once I get a chance to chew on them.

#NWelxn18 – first the numbers

That was interesting!

I have avoided talking too much about the election over here, relying on my election website to carry the campaign load while I kept this site on the day-to-day of council life. However, I am going to spend a bit of time between now and the resumption of Council stuff in November looking back at the election.

I am still thanking my many volunteers and supporters, the feelings are still a little raw, and lots of Monday morning quarterbacking is going on, so I am going to hold off on all that stuff for a bit and start with just the (preliminary, not yet official!) numbers, starting with number of votes:

On Council, Team Cote clearly dominated, not only taking the top 6 spots, but doing so with a clear numbers gap over the members of the NWP Party (6th place had 25% more votes than 7th place), who in turn had a pretty solid gap ahead of the 4 independent candidates (10th place had 38% more votes than 11th).

Voting percentages are a little wonky for Council elections because we don’t know how many votes each voter decided cast, but there were 71,627 council votes and 14,368 votes for Mayor, so we can infer an average of 5 votes per voter. There were something like 50,000 registered voters in New Westminster, so turnout it tentatively a little over 28%, about the same as last election (the exact numbers will have to wait until the official report- as we don’t know how many voters registered on the day of the election) .

The pie chart allows a little more clumping analysis. We can see that Team Cote candidates earned 59% of the vote total, NWP candidates 27%, and others 14%. Of course, there were 50% more Team Cote candidates than the others, so perhaps a better comparison is that the average Team Cote candidate earned 9.9% of the votes, the average NWP candidate 6.7%, and the average Other 3.6%.

Nadine Nakagawa surprised even herself by dominating the vote. The last time a rookie candidate led the polls for Council was in 1996 when a young Jerry Dobrovolny pulled off the feat. The vote count of all 6 elected Councillors (7,764 to 6,595) is quite a bit higher than last election (6,262 – 5,517), though the vote count for the 7th place finishers is not that different (5,297 in 2018, 5,165 in 2014).

For the fun of it, I made a bar chart mixing this year’s election results (blue) with last elections (in red) so you can get a sense of how the vote distribution changed:

There were more candidates in 2014, which makes for a longer tail on the distribution, but this display really makes the gap between Team Cote candidates and others stand out – getting about 20% more votes than their cohort in the previous election, where the NWP had very similar vote counts as their 2014 cohorts. This was a convincing win compared to last election.


On the School Board side, things are not as clear. The Team Cote candidate still swept the top spots, but the vote count was much closer:

There also isn’t a big gap between 7th place (and elected) and 8th place (less than 4%). The NWP candidates were not clustered, it is clear there was no “block vote” for or against the NWP. Danielle Connolly got 25% more vote than the NWP average, J.P.LeBerg got almost 30% fewer votes than that average.

The average ballot included 5 Trustee votes (72,335 compared to 14,368 for Mayor, see assumptions above) – curiously the same average as for Council even with one more opportunity to vote, and they broke down like this:

43% of the votes went to Team Cote candidates, 25% to NWP candidates, and 32% to others. Again, since there were different numbers of candidates in those three clumps, the better estimate may be that the average Team Cote candidate earned 8.7% of the vote (and all were pretty close), the average NWP candidate 6.2% (with a wide spread), and the average Other 4.5% (with two candidates standing well above the average).

The comparison between 2014 and 2018 is more interesting here than with Council. There were more votes in 2018 (about 14% more), but in contrast to Council, less of that vote went to the front-runners. With more candidates in 2018 the distribution is more spread out, but it will take a smarter political scientist than me to tell what this means!

Finally, in a campaign where there was much discussion of how diversity was defined, all of the new candidates elected were women – three on City Council and six (6!) to the School Board. This, and the cultural diversity of the candidates, may be historic for New Westminster. Though it is worth noting that between 1993 and 1996, there were three women on New Westminster Council, and Betty Toporowski was Mayor. Whether a person of colour has ever served on Council in New Westminster is the kind of question you would need to ask an historian.

UBCM 2018

Apologies to regular readers (Hi Mom!) that I have not been putting a lot of content on this blog recently. The campaign is in full swing, we are still doing our regular City Council stuff, and I have another job that keeps me occupied. Hopefully back to regular programming in later October. In the meantime, I am talking more about campaign stuff on my campaign Facebook page, and on the my campaign website and trying to keep this page about City stuff that isn’t campaigning.

However, I thought it apropos to provide a quick update on the annual Union of BC Municipalities meeting. I was not able to attend this year, mostly due to work and Council commitments. I did go up there on September 10th (disclosure: on the City’s dime) to attend the BC Municipal Climate Leadership Council quarterly meeting, and the Minister’s breakfast that is hosted by that Council (of which I am a member). It was a productive meeting, and we were able to discuss the BCMCLC’s response to the Province’s Clean Growth Intentions Paper, which was both supportive of the work the province wants to do, and suggestive of some further steps the province could take to support local governments in reaching the aggressive greenhouse gas reduction goals that are required to meet Canada’s Paris targets.

I then returned to Whistler on Wednesday (not on the City’s dime this time) to attend the Lower Mainland LGA meeting (I am a vice president) and to present the annual Community Energy Association awards to communities taking exceptional efforts to reduce their energy use and greenhouse gas emissions. In my role as Chair of the CEA, it was my honour to share the awarding duties with the Minister of Environment and Climate Change Strategy. I also had the opportunity to give one of the awards to the Mayor of Nelson for their Solar Garden project –and let her know that imitation is the sincerest form of flattery, demonstrated by New Westminster copying their model for our own Solar Garden project.

The good news coming out the UBCM is that some resolutions we sent to be debated were passed by the membership of UBCM. These were:

B-8: Alert Ready Emergency Alert System

… be it resolved that UBCM works with the Province of British Columbia to provide access to the Alert Ready (emergency alert) system to local governments in order to allow them to broadcast critical and potentially life threatening alerts to residents of their respective communities using the framework of the Alert Ready System.

B-54: Cannabis and Harmonizing Smoking Regulations

… be it resolved that UBCM urge the Provincial Government of British Columbia to extend the prescribed distance from a doorway, window, or air intake in which a person must not smoke tobacco, hold lighted tobacco, use an e-cigarette or hold an activated e-cigarette from 6 meters to 7.5 meters and prohibit smoking in all public parks by amending the Tobacco and Vapour Control Regulations and by ensuring the corresponding distances prescribed in the Cannabis Control and Licensing Regulations are the same.

And:
B-102: Updating the BC Motor Vehicle Act to Improve Safety for All Road Users

… be it resolved that the provincial government be requested to support modernization of the Motor Vehicle Act, addressing the recommendations in the Road Safety Law Reform Group of BC Position Paper entitled “Modernizing the BC Motor Vehicle Act” to enhance safety for all road users.

I have to admit, I’m pretty chuffed about that last one.

Bad Data

I never want to react to the Fraser Institute. The easy ad hominem attack is that they are the Canadian propaganda wing of Koch Brothers enterprises, and their attempts to shift public policy in Canada should raise concern, but the more substantive attack is that they produce terrible reports that would not earn a passing grade if they were handed in as an Economics 101 term paper. They are bad at data, so it is best if we ignore them.

Alas, I was asked by an intrepid local reporter to comment because the City of New Westminster is made to look fiscally irresponsible in their latest fresh-off-the-presses piece of decontextualized tripe, so I did a bit of a dive into the numbers. This turned into several hours of trying to reverse-math their numbers, because like the failing university economics students they resemble, they don’t actually provide raw data or point clearly to what their data sources are, instead providing derived numbers without the benefit of showing their calculations. They are bad at reporting data, and we should probably ignore them.

I dug around in the BC Government website they link to as a data source (this one), and after figuring out how they got all of the population for 2016 wrong (using projected estimates instead of readily-available Census data), I started to dig through the various tables and repeated calculations until I got results mimicking theirs. They primarily used “spending data” from this table, and “revenue data” from this table. But they clearly didn’t know (or didn’t care) that New Westminster’s data includes the financial reporting by our Electrical Utility. They are bad at interpreting the data they have, so it is best we just ignore them.

For context, New Westminster operates its own Electrical Utility. It has since before BC Hydro existed. We hold on to it because it is a great deal for the residents of New Westminster. Using 2016 numbers to be consistent with the Fraser Institute report (See Page 90 of this report for the utility’s 2017 numbers), our Electrical Utility sells about $45,000,000 worth of electricity to residents and businesses in the City, at the same rate (more or less) as those customers would pay BC Hydro if they were in another Municipality. It costs the utility about $33,000,000 to purchase that electricity from BC Hydro at bulk wholesale rates. About half of that difference goes into operating the utility (paying staff, buying wires and building substations) and the other half is paid to the City as a dividend. We are the only Municipality in the lower mainland that does this, so we are the only municipality that includes these numbers in their expenses and revenue tables. This is important context. The Fraser Institute is bad at context, which is why we would all be better off by ignoring them.

Because of this bug in the data, their report suggests that New Westminster has “the second highest municipal spending” per capita, along with “the second highest municipal revenue” per capita. They even have bar charts to prove it:

The problem being, New Westminster’s electrical utility “spends” about $38 Million a year, and it generates about $45 Million in revenue. If you take this into account, those bar charts look very different:

The shorter and more accurate story here is that New Westminster (outside of the electrical utility) spends slightly above the regional average on a per capita basis, and collects slightly less than the regional average in taxation and fee revenue. Think about that for a minute.

“Spending” in the local government context means putting police officers on the street, mowing lawns in our parks, and providing swimming lessons to your kids. The money we spend is providing services to our residents, and we do that at a slightly higher rate than the regional average. At the same time, the revenue we collect from our residents in the form of taxes and fees is lower than the regional average. An alternate Fraser Institute headline may be: New Westminster delivers more for less!

Ironically, part of the reason we deliver more for less is the electrical utility that can buy electricity for wholesale, sell it for retail, and provide a dividend to the City which we can use to provide services that would otherwise need to be paid for through taxes. Arguably, having an electrical utility is the most entrepreneurial thing we do, and is something that the entire “run government more like a business” Fraser Institute crowd would normally celebrate.

There is more in this report, including tables showing the City’s residential taxes are below average for the region (12th highest of 17 municipalities), and our debt servicing costs are average, but that kind of story – “City is about average” – doesn’t make for a very exciting headline.

Alas, New Westminster is just kind of average. And when it comes to managing finances, this is not a bad thing. Every financial decision is about balancing the cost with the priorities our residents and businesses expect us to address. I am proud of the level of service we provide in New Westminster, and our ability to do that while keeping taxes below the regional average.