Having a bit of time over the Christmas break to think back about the year that was 2022, I am mostly thinking about a year of strategizing, planning, and bringing teams together like I have never experienced before. It is perhaps ironic then (though being the Alanis generation, I may not really understand irony) that my life path in 2022 was nothing I would have predicted one year ago today. This was not the path I expected, but it was a path I navigated as events occurred. So excuse me if my “Year in Review” post is maybe more self-reflective than community-reflective than is my usual.
December last year was the tail end of a challenging time. The City had weathered the worst of the Pandemic admirably, but was still seeing significant challenges around overlapping regional crises related to homelessness, spiraling housing costs and inflationary pressures, the poisoned drug supply and a regional emergency response system that was just not delivering for those suffering from health crises. There was a lot of bad news locally and planet-wide. People could not be blamed for being in a bit of a funk.
At the same time, there was a lot of talk among folks around the New West council table about who would run again. This became pressing in December, as the new campaign finance rules limit the amount of money candidates can contribute per year for their own campaigns. If you were going to run in 2022, it was a good idea to do a little fundraising in 2021, or at least put your personal maximum donation in the bank before the year end. I was very uncertain about running again for Council, and as I was leaning against it I did zero fundraising in 2021. But I hedged my bets by at least opening the bank account and putting in my personal donation.
It may seem strange for the current Mayor to suggest I was uncertain if I would run for Council again just 12 months ago, but Mayor and Council are two very different jobs and we had a solid Mayor. Council would mean another 4 years of continuing to hold my professional life slightly on the side burner: I was working half time, but my heart was not in it to build my geoscience career like it had been in the past, and the half-time work meant I wasn’t really doing the professional development that my work required if I really wanted to excel. I really enjoyed the work of City Council and the team I was working with, but I had two half time jobs, both needing fuller commitment. Something had to give.
There were also some great candidates who reached out about their interest in running for Council (some who are now elected, some who are not) and when I got into the Councillor job I made a personal commitment to not stay around too long, especially not so long that I block the path for great new candidates who can bring the kind of energy and ideas that motivated me 8 years ago. So, December 2022, I was considering not just whether I wanted another 4 years of Council, but whether I was needed.
Then on the first day of 2022, Mayor Cote surprised me (and many others, I suspect) by announcing he would not be running for re-election. That put the scramble to everything, and resulted in my 2022 being divided into four not perfectly equal quarters. All with the common theme of teambuilding.
The first was mostly discussions with friends, supporters, and political allies to determine if I was the right candidate for Mayor. If I was electable, and if there was a broad enough support base out there to get elected. This also included talking to some other potential Mayoral candidates to determine if I should throw support behind them, if they even wanted the job. There were SWOT analyses, hard personal questions asked, and even values challenged. There was also some soul-seeking and conversations about the type of campaign and vision I wanted to present – positive, optimistic and pragmatic. Is that what people would vote for in 2022?
The second quarter began when I was convinced there was a viable path, but I needed a team and a broader support group to run a winning campaign. Running as an independent (as some friends recommended) was an idea I dismissed through these early stages. I think a Mayor needs a team, a supportive Council who can help get things done. With the wide variety of topics we address on Council, a leader needs a strong team of people with diverse experiences to guide them and support them. I already mentioned there were several great new candidates interested in running for Council; I wanted to work with this team. The work of putting a party together was bigger than me, there were many hands that did much more work than I, but helping in that process informed me further on whether I was ready to do the Mayor job.
It was also about putting together and gaining the support of the volunteer team for the project that is a “campaign”. Many community leaders don’t want to run for election themselves, but want to help like-minded folks get elected. Some provide financial support, some volunteer support, some real party structure organizational support, and many a combination of all three. Just as a Council is a team, a campaign is a team. With a good team, you can worry about being a candidate, and know the logistics are taken care of. Without knowing I had this team behind me, I would not have run, because I would not have been successful.
The third quarter was the campaign itself. Parts of it began as far back as January with that self-reflection, but the really intense campaign period began in the last half of the summer. Doorknocking every night, working with the team to develop platform and communications, fundraising and events. It is non-stop, and it never feels like you are doing enough. And though I had been involved in many campaigns before, supporting others and in running for Council two times: the Mayor campaign was something different.
There were ups and downs during the campaign, a few all-candidate events went great, some not so great. Sometimes I read the media and felt good, sometimes I was frustrated by it (Facebook was a complete shit-show, but that’s another blog altogether). In contrast, the doorknocking and the booth-style direct engagement were almost universally a positive. We had a great team of candidates it was a pleasure to share doorknocking time with, and people of New Westminster were their usual: engaged, interested, friendly, thoughtful, and inspiring. As the campaign went on, it was the doors and the booth (or more, the talking to people at both) that gave me energy every day to do the work, because the campaign overall was exhausting. We also had phenomenal doorknocking weather, and an incredible group of volunteers that brought a little joy every day to what is often an arduous journey. And that attack ad – that is some great scrapbook material!
This makes the fourth quarter the post-election period and the new job. The rest of 2022 was mostly filled with various ways of integrating into the job. This means lots of meetings with senior staff and stakeholders in the community, getting the new Council up to speed on the “State of the City” and some deeper thinking about what the “want-to-do”s and the “need-to-do”s are for the next year, and the next four years. And ow there are evets again, where I am now expected to have a few inspirational (!) words.
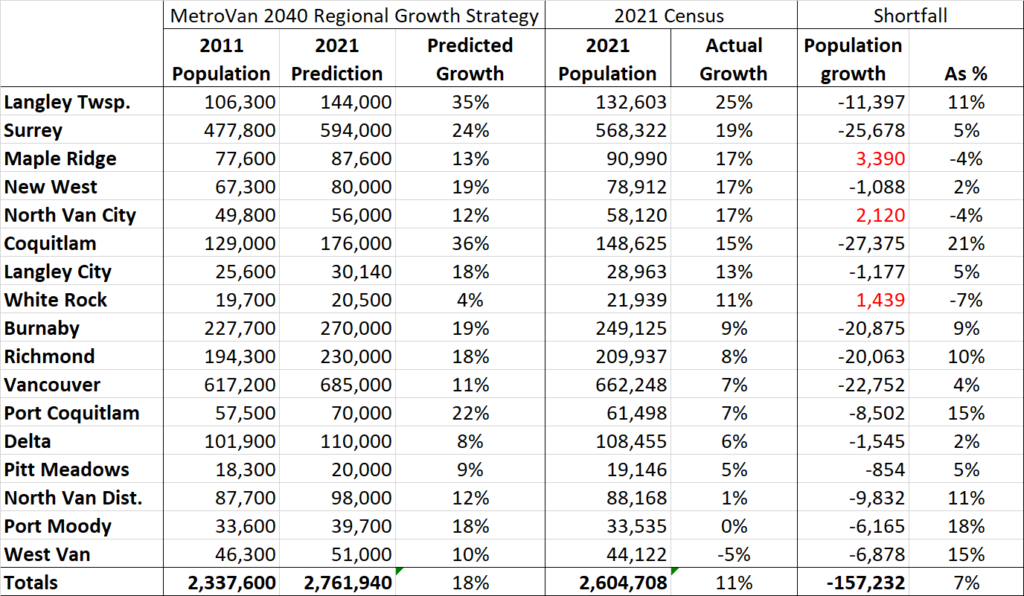
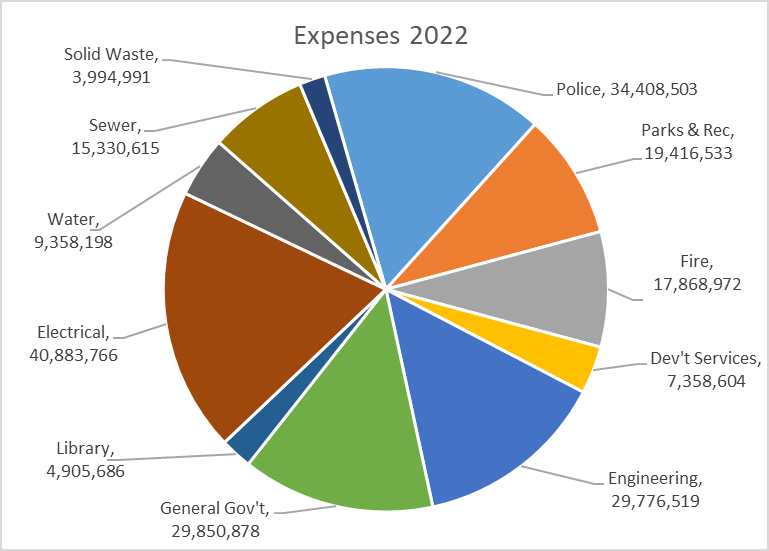
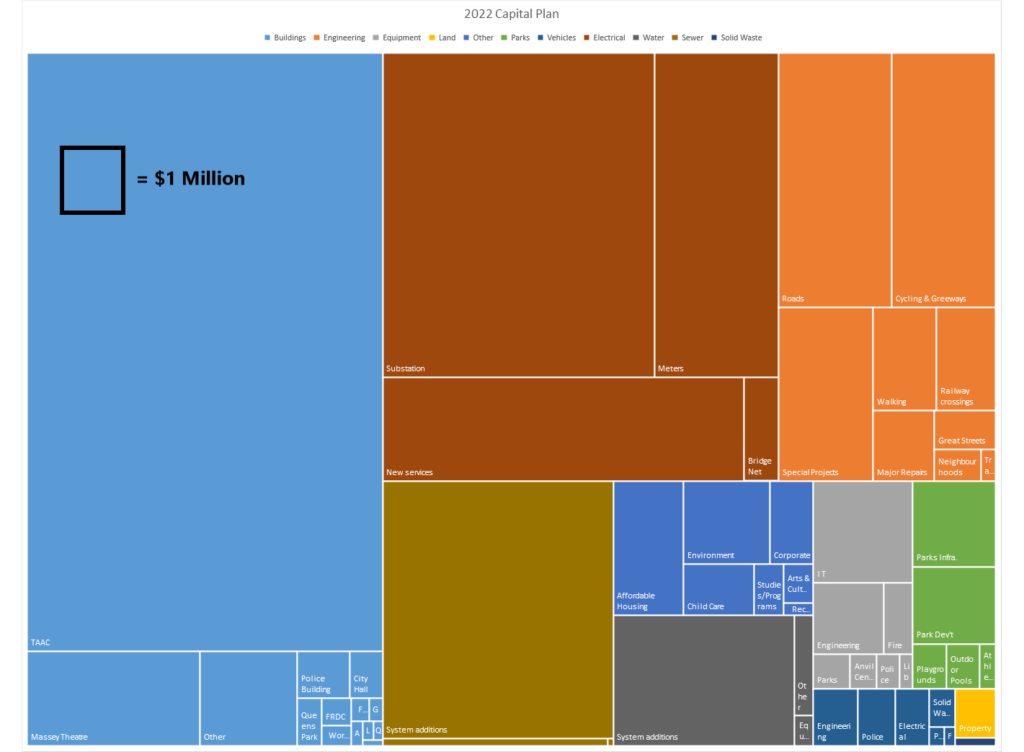
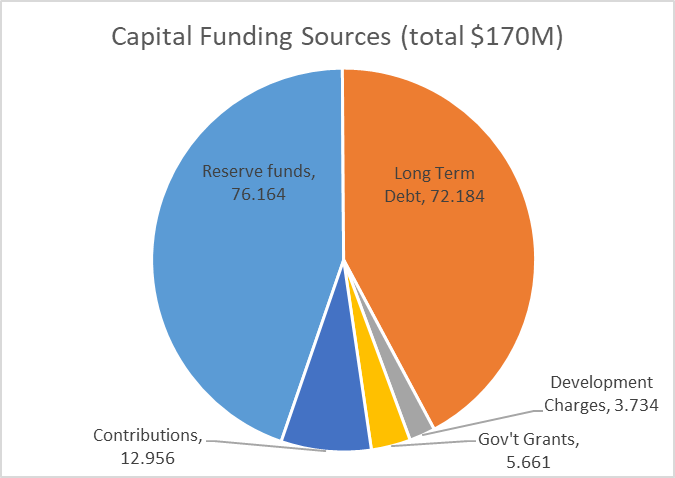
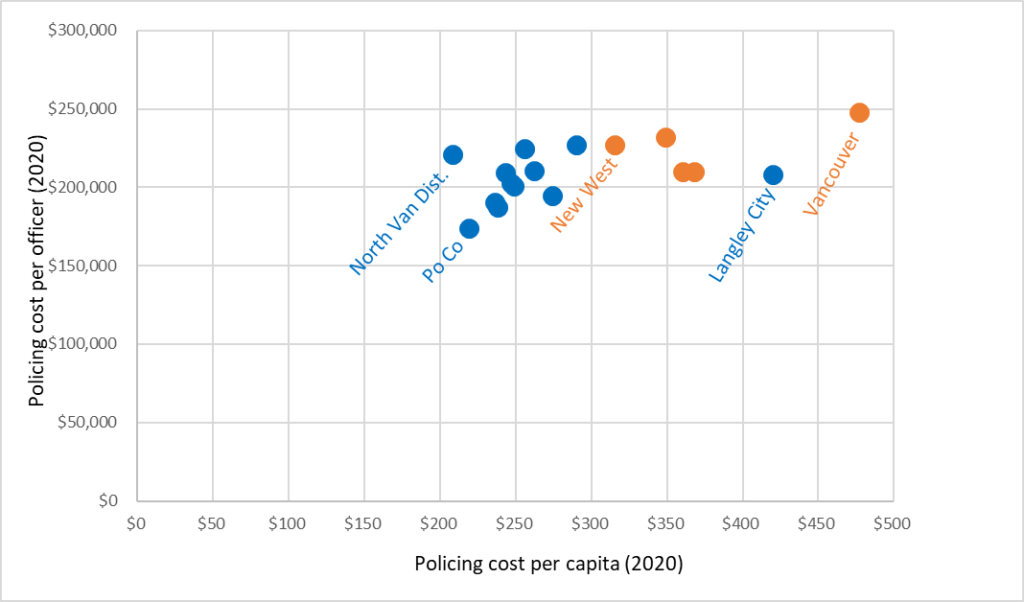
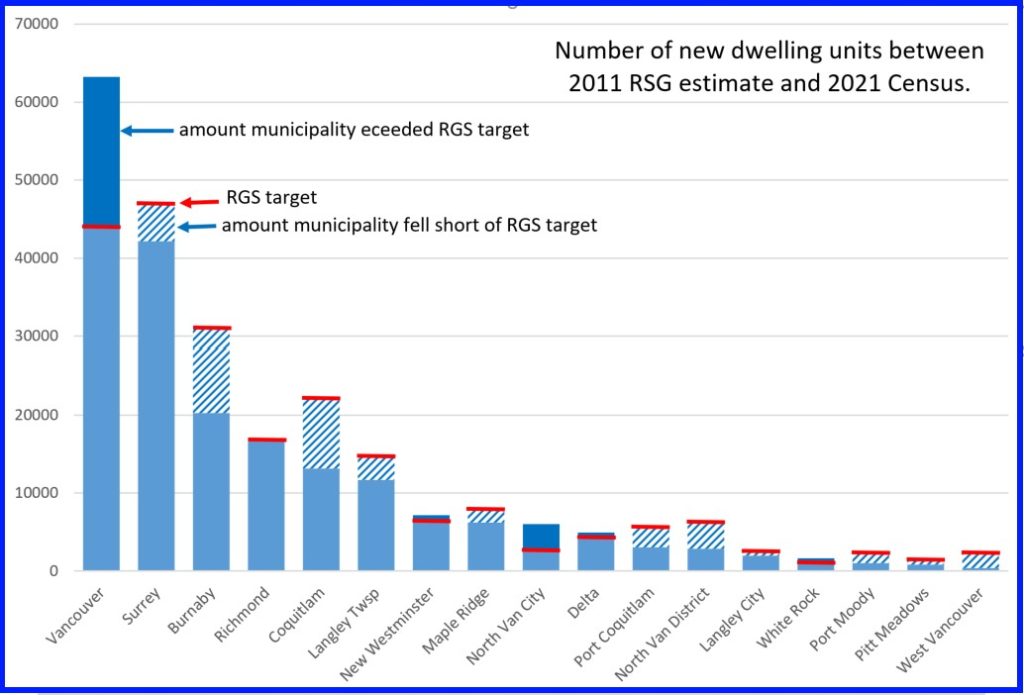
The good news is that the State of the City is good. We are in a decent (but not decadent) financial situation considering the chaos of COVID and our very aggressive capital plan, but costs are going up everywhere, and the City is no exception. Thanks to Mayor Cote’s leadership, we are in a good shape on a lot of policy fronts – in recent conversations with regional leaders and new Ministers in the Provincial Government, our leadership in housing policy across the spectrum has been noted repeatedly. Our role in getting PACT rolled out not just here but in other communities is also seen as demonstration of leadership, ad the multi-jurisdictional approach to addressing Downtown challenges is a great work in progress, with more to come. At the same time, the conversations we are having here on active transportation infrastructure sounds like debates from 15 years go in Vancouver, and 5 years ago in Victoria. A medium-sized City can’t be a leader on everything.
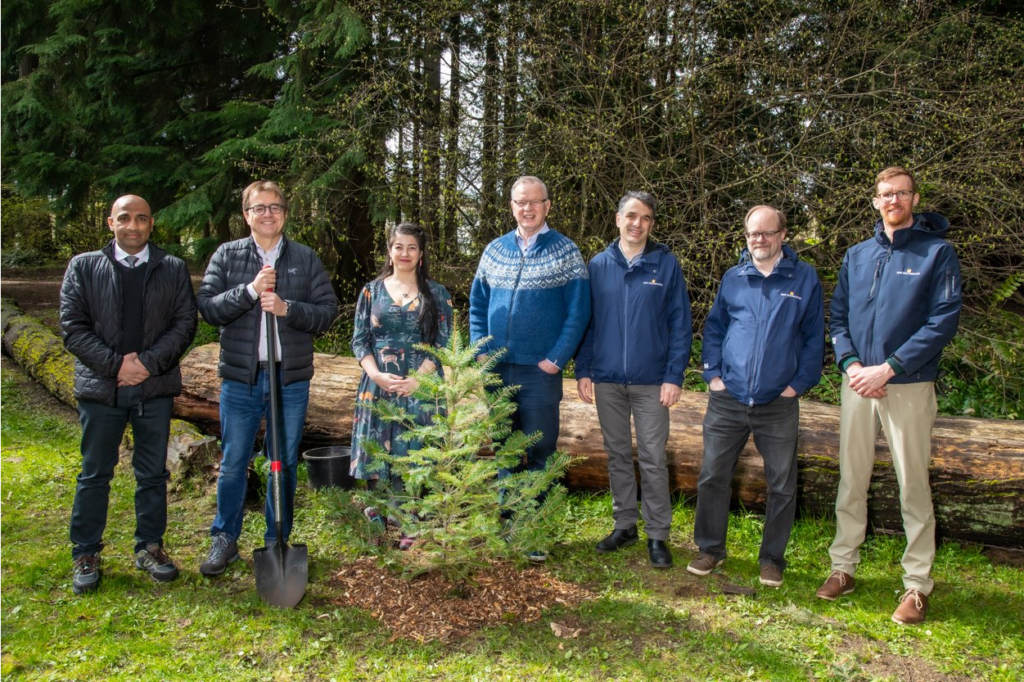
2022 also saw a return to one of the things that makes New West such a great place to live: we were back to events. Pride and Car Free Day both rocked Columbia, Fridays on Front were appreciated by significant crowds, Uptown Live and Recovery Day brought thousands to Uptown, and all kinds of different events like PechaKucha and the S&O Anniversary Party and the Mushtari Begum Festival the On Your Block Festival and the Hyack Parade and Play the Parks, etc. etc. There were so many ways for folks to connect again, to build that community spirit that was challenged for two years. It was a fun year.
And this winter, we had a few reminders that the day-to-day work of the city never stops. It has already been a challenging snow removal season, we have had crews working long hours and burning through a lot of salt and diesel to keep up with the changing conditions. The social media feedback has been demonstrative of something…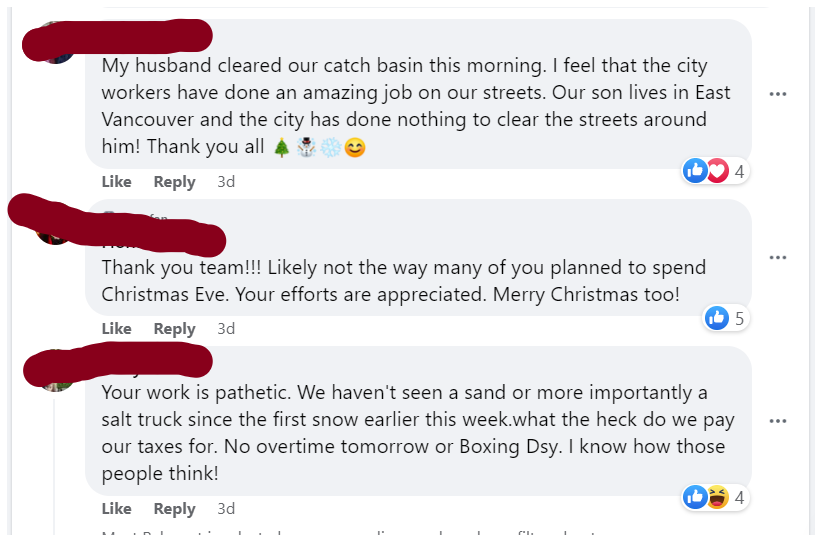
…admittedly, a bit of a mixed message.
I’m also spending some time this break thinking about how to engage differently in Social Media. Partly because the new job changes how my engagement is read, partly because I simply do not have time to track and respond to social media the way it sometimes desires, and partly because during the election I found judicious use of the “mute” button improved my outlook on the community, what with the anonymous trolls and racists filtered out. But this will be the topic of future posts and further reflection as the social media landscape is rapidly changing. Apparently Mastodon is a thing now?
So, to sum up, thank you to everyone who took part in making New West an exciting, engaged, and proactive community in 2022. There is much good coming in 2023, though I am sure the upcoming budget discussions will be contentious here as in most communities, as cost are going up and the austerity hawks will be making their damaging claims about the need to strip back community services. One of my reads over the break has been Andy Merrifield’s “The New Urban Question”, an exciting review of the impact of neoliberalism on not just the function of “The City”, but on the very nature of citizenship in the new Urban Realm, worldwide. It is an empowering and challenging read, and a reminder that the work we are doing has a purpose, even if the battle has no end.
Happy New Year! See you in Council Chambers – and around town – in 2023!
 And we have been talking about it in the City as we review our Emergency Response programs and work with our First Responders to assure we are more prepared next time. I talked