There were some recent letters in the Record, lamenting New Westminster’s out-of-scale property taxes. Some feel we have the highest property taxes in the region, one fellow last year even opined the second highest in Canada!
As I previously posted, there are many ways to measure taxes, and Mil Rates only tell part of the story. It gets even more complicated when you add utilities to the mix. Municipalities have different ways of paying for your water, sewer, and trash collection, and this impacts what your property tax bill looks like in June.
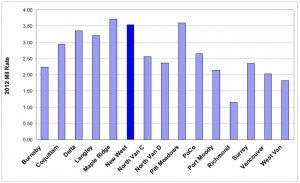
As part of my continued interest in calling a spade a shovel, I did a little on-line digging around, and here are the 2012 Mil Rates for the 15 Lower Mainland municipalities that publish this stuff on-line (or at least those who publish it in an easy enough way that I didn’t spend my weekend digging through Bylaw pages).
Richmond can claim the lowest Mil Rate at 1.15, with West Vancouver second at 1.81 and Vancouver a close third at 2.02. New Westminster is third highest at 3.54, with only Pitt Meadows (3.60) and Maple Ridge (3.71) higher.
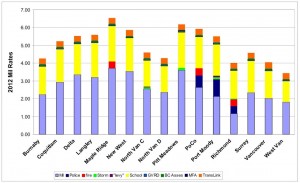
However, many cities list their fire, police, storm sewerage, or other services and “levies” separately from their Mil Rate. These are not utilities (which are defined in the Local Government Act), but part of the regular City service. Also, there are senior government taxes applied to property taxes: School taxes (set by the Province), along with GVRD, TransLink, BC Assessment Office, Municipal Finance Authority. Add these all up, and you get a truer Mil Rate comparison:
 |
| You can click to make larger- tax free! |
Now we see West Vancouver pull into its rightful place as the lowest Mil Rate Municipality, with Richmond and Vancouver neck-to-neck for second. New Westminster moves up to 12th, now that PoCo’s “levy” load is added on. The Gap to Places like Port Moody and Langley also tighten somewhat. Still, 12th of 15, with a Mill Rate 70% higher than the lowest in the region, is nothing to brag about, right?
Remember, that these Mil Rates are applied against the assessed value of your house. Since houses in New Westminster cost less than in Vancouver, and more than in Pitt Meadows, the amount of tax you pay doesn’t index all that well to Mil rates.You can use the BC Assessment Office data to figure out the “average” house price in each Municipality, but that does not really tell you what the “typical” house price. Medians and means are both overly influenced by outliers, and when looking at house prices from Maple Ridge to West Vancouver, there are a lot of outliers.
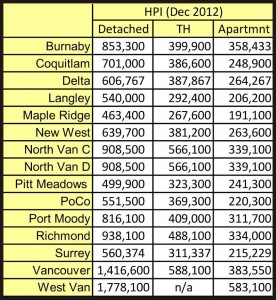
Luckily, the good people at the Greater Vancouver and Fraser Valley Real Estate Boards have a better database of high, low, median, and ( this is most important) typical house value. And they break it up by detached, townhouse/rowhouse, and apartment. You can look at their methodology and explanation of why “typical” is better than median or mean here.
Here is the list of the values of the typical house, townhouse and apartment for the 15 municipalities:
Not surprisingly, New Westminster is in the middle-lower part of the list as far as property values go; generally higher than places south and east, lower than places west. Blame the prevailing winds.
The fun part is combining this table with the Mil Rates Table. I know Mil Rates are based on Assessed Value, not the selling prices that are used in the Real Estate Board stats, but can we agree that the assessment process is equally unrepresentative across the region, and that for the purposes of comparison, the data pile is fair, if not the individual data? Again, the result is accurate, if not very precise.
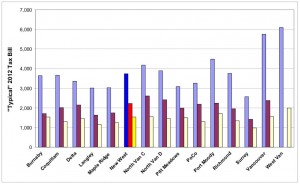
So here are tables of “typical” Property Tax Bills for the 15 municipalities, based on domicile type, not including seniors discounts, Grants, or the three big utilities (water, sewer, and trash – those will be another post, there is already too much math going on here).
New Westminster is, as might be expected, somewhere in the middle of the pack for most housing types. Not the highest-tax municipality in the region, not the lowest. Somewhere between the 5th and 7th highest, out of 15 municipalities.
This doesn’t comment on the comment that everyone across the region is paying too much tax, but it kind of takes the wind out of the specific examples many cite when saying City X pays way more than City Y. So next time someone suggests their “taxes doubled” since moving from Vancouver to New West, congratulate them on their new home, since they would have had to upgrade from a way-below typical $600,000 house in Vancouver to a somewhat-above-typical $850,000 place in New West (or proportionally similar increase). Which seems like a nice upgrade to me.


Two major points missing from the analysis are: 1. Location, location, location must be factored into the equation (ie. somebody on the West side of Vancouver should not being paying the same tax rate as somebody in Port Coquitlam because the Vancouverite has an advantage of proximity to downtown, the ocean, a fully developed infrastruction, etc). 2. Amenities must be factored into the equation (ie. a person situated in, say Yaletown, has immediate access to the largest public library, a few great community centres, the seawall, shops, good public transit, etc. whereas a person in an eastern city may very well have a subset of those)
This will definitely helps the people of New Westminster. There is real estate for sale in New Westminster that I am planning to buy one and this info will help in my decision.