I have already opined about the potential to replace the Massey Tunnel back when the rushed “consultations” were launched in the Spring. People with better minds than mine have already challenged the base assumptions built into the apparent need for a replacement using the Ministry of Transportation’s own numbers.
This week’s announcement that this low-priority election bauble was pushing on, full steam ahead, despite the objection of pretty much every Mayor in the region* except for the one who doesn’t want to pay for it, is still a little confounding. Our all-but silent rookie Minister of Transportation continues to dither about Transit funding models and a still-born referendum, everyone from Teachers to Nurses to Social Workers are being told there is no money in the kitty for any of their essential programs, but for some reason this multi-billion dollar boondoggle is a Provincial Priority. Depressing, but not shocking.
Since the announcement was amazingly bereft of details: size, scale, scope, costs, tolls are all things we can only speculate on. The only substantive thing we have to base our speculations upon is the fly-through animation of the proposed bridge, a fanciful piece of salesmanship no doubt created in a wet dream by the very engineering firms and Project Managers that are now engaged by the Ministry of Transportation to sell this product to a reluctant taxpayer consult on the project design and implementation on behalf of the Government, so they can eventually get paid by the same Government to build it. You know who you are.
First off, note the lane count. 10. Well, 12 if you include the “safety lanes” that appear to be full-lane width on this rendering. Plus a bike/pedestrian path. As drawn, this bridge will be wider than the Port Mann, the alleged widest bridge in the world.
Yes, two of those lanes will be “HOV” lanes. Note the HOV lane is dominated by cars and commercial vehicles, which makes them very different than the HOV lanes we know and love.
Note no substantial changes to the design of the Steveston Highway intersection as far as lanes in and lanes out, (although it looks like the overpass will be blown out to 4 lanes, which will not do much for Stevenson and No 5 Road). Note especially how the free-flowing traffic from the new bridge disappears as it exits to the 2-lane Steveston Highway, as if by magic. The magic of road builder renderings. That traffic is distinctly “somebody else’s problem”. Or the next problem they will get paid to solve.
Nor do will see substantive changes to the Highway 99 / Highway 17A intersection. Except, of course, the current 6-lane Highways that extend through farmland away from the Bridge north and south are shown to be 10 lanes wide as far as the eye can see. Pity the Oak Street Bridge, I-5 Seattle, here we come.
Note the pedestrians on the bridge. There are a dozen pedestrians and three cyclists shown. Cyclists I’ll give you, but the bridge is 3 km long, with the north end ramp more than a kilometre from the nearest doorway of any kind, and the south end something like 5 km from any likely destination, be it residential, commercial or recreational. Where the hell are these walkers going?
Perhaps they got tired of waiting for the transit that never showed up, as the established bus stops on the Richmond side of the bridge have been removed, and the HOV lane moved to the middle of the freeway, so Transit connections have clearly not been thought out here. Probably TransLink’s problem to solve.
At least I give the rendering props for truthfully representing the types of vehicles that use the Massey tunnel route. In the animation, 83% of the vehicles shown are private cars, 14% are commercial trucks, and 3% are buses. Admittedly, they are “tour” bus types but let’s assume the animator meant for these to be ultra-luxury Transit buses that will come with expanded Transit funding to go with the new road (yes, that was sarcasm).
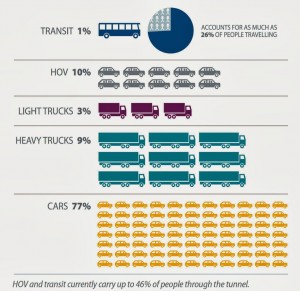
These stats are close to the actual current count of traffic going through the tunnel: 87% cars (including HOV, which means at least one passenger), 12% trucks, 1% transit.
 |
| Source: Massey Tunnel Replacement Consultations. |
Actually, the 2% increase in trucks is almost exactly the increased number that will result from the most ambitious Port expansion plans at Terminal 2. Keep that 2% number in mind when you are told “Goods Movement” is a primary reason for spending a couple of billion of your dollars to replace the tunnel.
In contrast, the displayed tripling in transit service is clearly fanciful, as TransLink has no money to maintain the routes they currently run. This is important, because if transit use (which at 1% of vehicles, already represents 26% of the people travelling through the tube) tripled, then the numbers of cars going through the tunnel would be reduced by half. Which would end our congestion problem for a much lower cost than a $X Billion bridge.
Alas, I heard Moe Sihota speaking for the NDP on the Rick Cluff Radio Confrontation Hour (follow link to about 1:50:00) this morning, also agreeing that the tunnel needed to be replaced with a big shiny bridge, using the same incorrect data and false assumptions as Premier McSparkles(Tm). Of course, he disagreed with Colin Hansen on some arcane aspect of the funding or the opportunism of the announcement, but he was all for pissing away you tax dollars entrenching another generation of motordom.
This leaves the 100,000 daily transit users on the under-serviced Broadway Corridor and the tens of thousands in Surrey loading on stuffed and increasingly unreliable SkyTrains every morning wondering who represents them.
