I am returning to a common theme here in the blog, because I like to look at data, and have recently had a resurgence of folks suggesting to me that New Westminster is the highest taxed city in Christendom. Well, maybe only in British Columbia. Recently, I noticed a Councilor in another municipality puffing his own tires about how prudent the tax regime in his City was by calling out New Westminster as specifically worse tax- & spend-thrifts. Which allotted me the excuse for the following subtweet: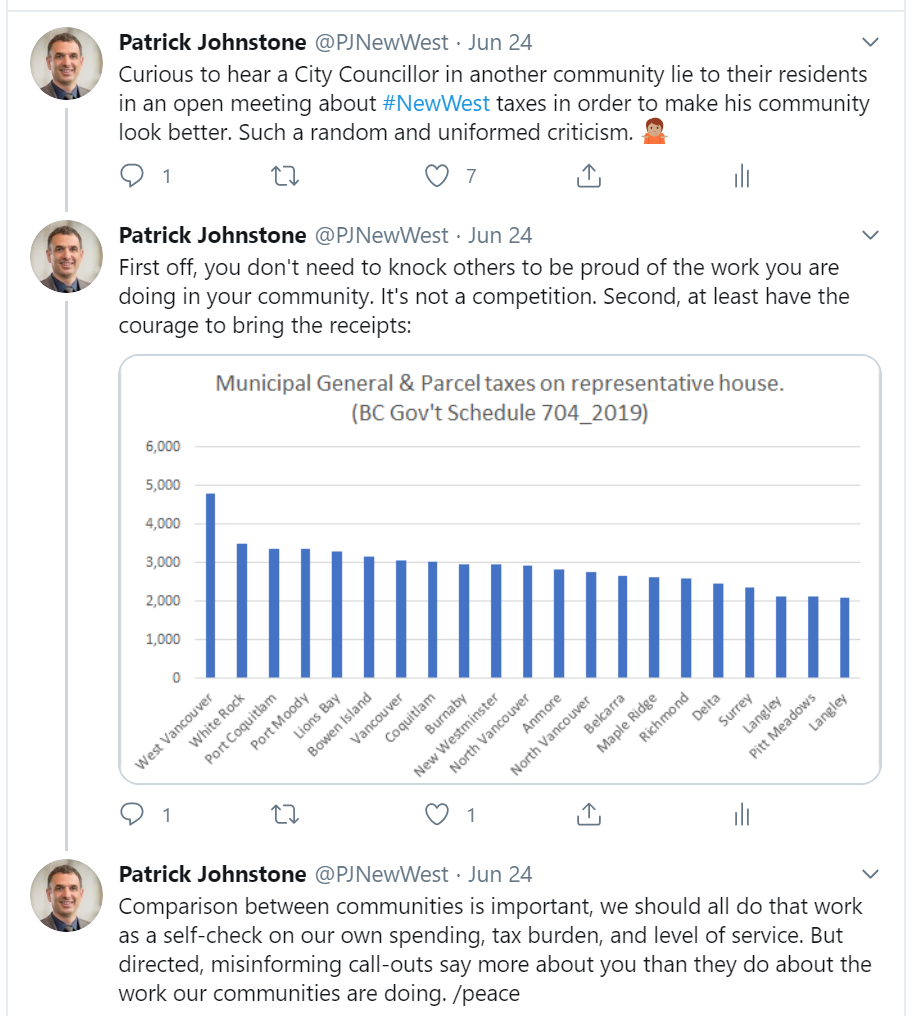
That the City that Councillor represented was well to the left of New West in the graph above was left unsaid, as were his name and that of his community, because I really don’t think it is a competition. Moreover, the problem with graphs like above is that they are one simplified analysis, and as I have tried to demonstrate in many blog posts like this over the years (Here with 2019 numbers, Here from 2015, Here where I compared taxes and utility rates, etc, etc. ) there are various ways to compare property taxes between Cities, and any comparison is useless without context. Some more useless than others.
Cities primarily provide services to people. This is why we generally rank the “size” of a City by population, not by square kilometers. The cost of providing services also most closely tracks with population. So when we talk about tax burden, certainly in the sense that our nameless Councillor was talking about it, we are talking about how much you pay for taxes as a resident of the City, which is easily measured by the taxes collected per capita: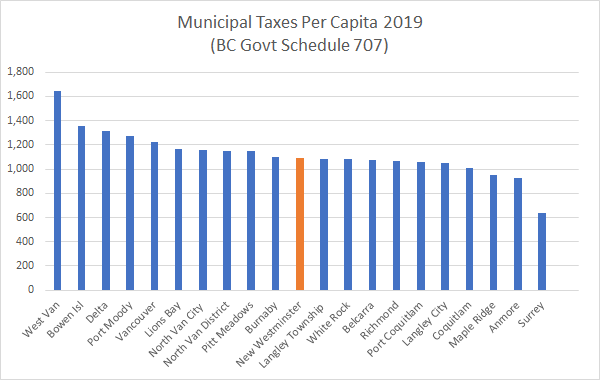
The BC Government collects these stats every year, and report out on “tax burden” on a spreadsheet they call Schedule 707. You can read it here. The table above was generated by dividing the 2019 “Total Municipal Taxes” from each City by the population (2018 estimate, because that is what is on the Schedule). New West collected just under $84M in taxes a population of just over 76,000 people, for a per capita tax of $1093. This puts us right in the middle of Lower Mainland municipalities. The average of these per capita numbers is $1123 (New West is a little lower), but the average tax burden is actually $1042 (New West is a little higher). This makes sense based on the different ways you can calculate the average, but fair to say New West is pretty firmly in the middle of the region.
This first chart compares all municipal taxes, though, and residential property tax – that collected from homeowners and landlords of rental properties – is only a portion of this. We also collect taxes from businesses and industries and utilities and such. Fortunately, Schedule 707 also break taxes down by property class. New Westminster collected just under $52M in residential taxes from those 76,000 residents, which works out to $675 per capita: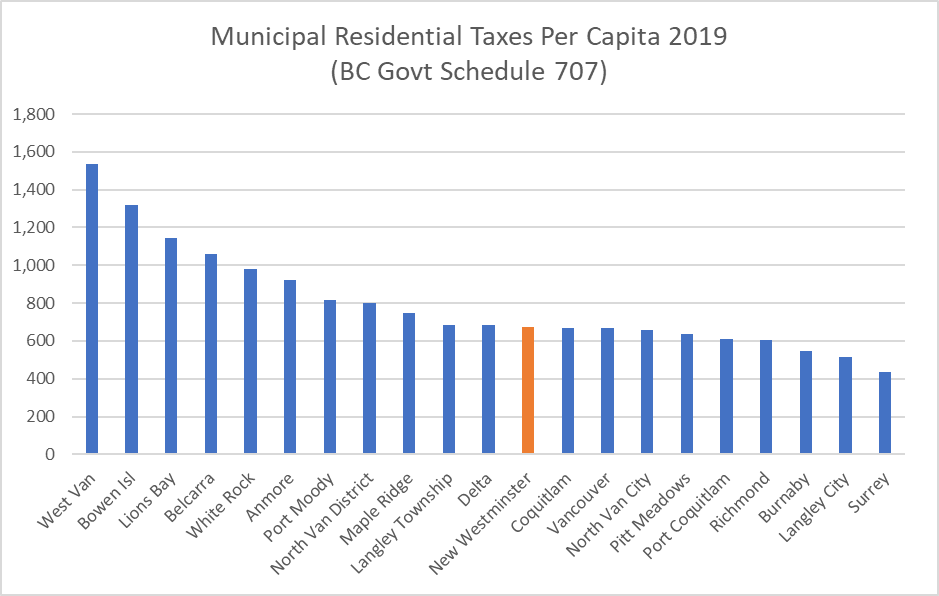
As you can see, that puts New Westminster just below average across the region. You will also note the municipalities that leap to the left side of the graph tend to be residential communities with limited commercial and industrial properties. Without those businesses to prop up the expense of the running the City, residential property owners have to pay more. Here is the commercial and industrial taxes collected per capita in 2019: 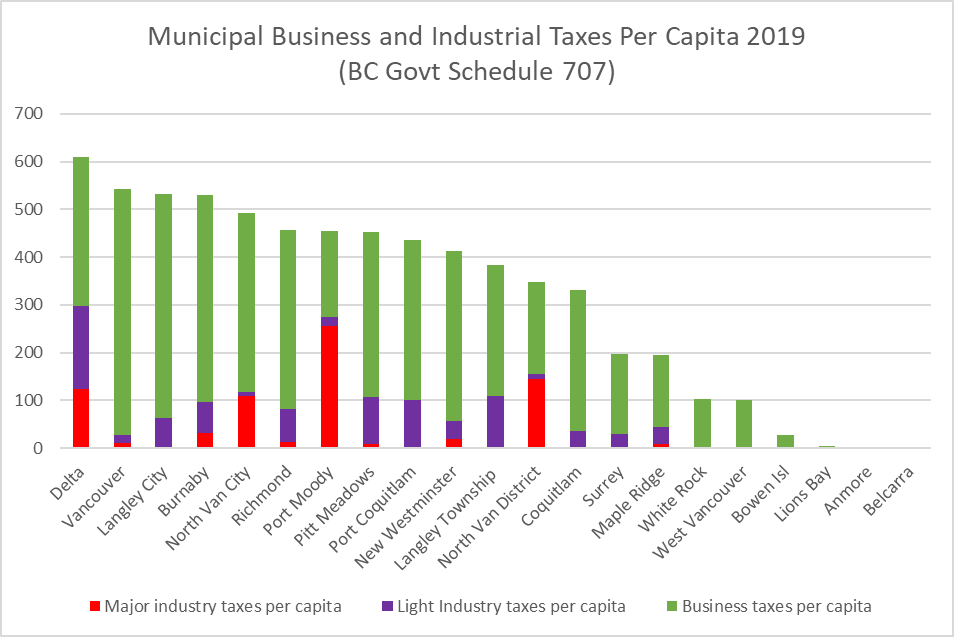
In this red is “Major Industry” like the Kruger paper plant or big industrial areas like Annacis and Mitchell Islands. Purple is “light industry” like the type of warehouses you drive by on the Mary Hill Bypass or in Port Kells. Green is “commercial”, which means retail, restaurants, malls and office buildings.
As you can see the distribution of this type of development is unequal across the region. Vancouver is the commercial centre of the region, and has oodles of office and retail space downtown and along the Broadway corridor. Delta has Annacis Island and the River Road corridor, that huge industrial reservoir allows them to keep their residential taxes low. As a proportion of property tax collected, New Westminster gets about 38% of its tax revenue from commercial and industrial properties and 62% from residential, which again puts it somewhere in the middle: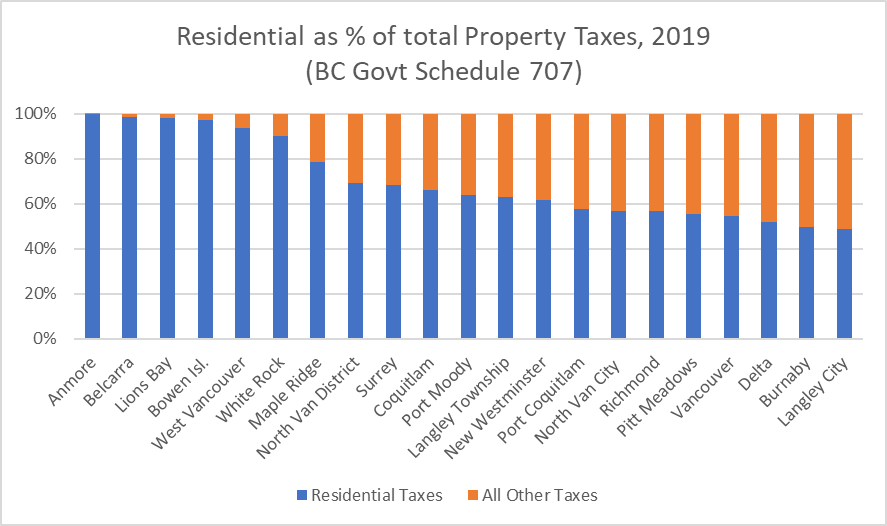
Unfortunately, commercial and industrial taxes are much harder to compare across the region. “Per Capita”, as I have used here, feels wrong. Raw numbers or rates are hard to compare because the value of commercial real estate in Downtown Vancouver is very different then the same office space in Langley, with New West somewhere in the middle. The pressures, costs, and relative utility of industrial land varies even more widely across the region. I will try to dig more into that in a follow-up post, because there are a few ways to look at business taxes in New West that make it look like we may be a little out of the ordinary.
But when ti comes to residential taxes, it is clear that New West is neither high or low taxed relative to the rest of the region. And there is a good case to be made that the Lower Mainland of BC has among the lowest residential property taxes in North America. But I’ll let someone else make that case.
For fairness you should add a comparison of the mill rate. You are a typical politician painting the story you want the public to see. New Westminster has an extremely high mill rate, why wouldn’t you show that comparison?
Hi Kelle. I have actually talked about Mil (or (Mill) rates several times, and tried to explain why they are a terrible way to compare taxes between municipalities. This primer from 2013 has pretty dated numbers now, but the facts remain the same: https://www.patrickjohnstone.ca/2013/01/what-is-mil-worth.html
Just so you know its only your opinion that comparing mill rates is “terrible”, the reason it is terrible to you as it doesn’t support your desire to make us think we are being fairly taxed
So you think New West should have the same tax rate as West Van? in 2019, West Van had a residential tax roll of about $48 Billion, where New West has a residential tax roll of $21 Billion. At the same time, our population was 80% larger. If we had the same tax rate as West Van (which seems to be the number you think we should compare), then New West would have 1/4 the revenue per capita. What do you think that would mean for our parks, our roads, our recreation centres, our emergency services? At the same time, you don’t think it is relevant that people in West Vancouver paid more than twice as much in property taxes in 2019 than New Westminster residents did? I guess we need to disagree then.