I read this headline, and my best reply is: Yep, I share your frustration.
I hear the concern expressed by residents in New Westminster when they see utility costs are going up at rates much greater than inflation. However, I am challenged in trying to find an alternative approach that balances operational costs while planning for long-term sustainability of the utilities. Its not from a lack of concern or empathy for the impact of rate increases, it is more about responsible management of the budget in a way that doesn’t threaten the financial sustainability of the utilities.
A 7% annual increase (adding up to a 40% increase over 5 years) sounds like a lot, and is clearly well above CPI, which is predicted to be between 2% and 2.5% for the next few years. However, the cost to operate our utilities is also increasing much faster than CPI. The best I can do here is unpack some of the details.
Let’s put aside the electrical utility for a bit, because Council sent those proposed changes back to staff for some more work, and we will be having (I suspect) a deeper conversation about those rates in a future meeting. That leaves the three utilities every City deals with: Water, Sewer, and Solid Waste. Here are the changes as proposed:
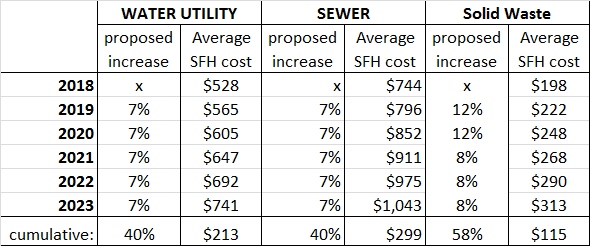
All the numbers I use in this post are from the utilities report we received last Council meeting. You can read it all here, starting on page 19.
Note the “Average Single Family Household” cost is an average, and your experience will likely be different. Many people in multi-family have their own commercial solid waste services, so pay nothing to the City for that. The sewer and water rates are flat rates to Single Family detached houses, but metered charges to multi-family dwellings. This is an estimate of the impact to the average household, not your exact bill.
Still, next year this average household will likely pay on the order of $100 more for utilities, and by 2023 pay $600 more a year than they pay now – that is $50 extra a month.
To get a sense of why the rates are going up, here is where the City spends that utility money:
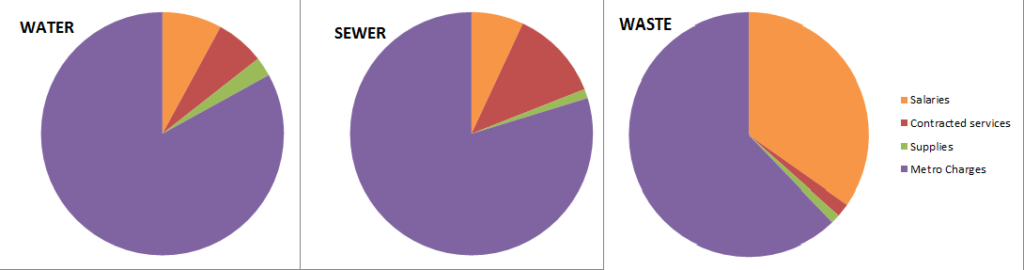
In all three utilities, the majority of the cost is what I slightly misleadingly labelled “Metro Charges” – the money we pay to other agencies to supply the water or to take away and responsibly manage our waste streams. Metro Vancouver provides clean, treated, and pressurized water and charges us per cubic metre delivered. Similarly, Metro Vancouver takes our waste water and sends it to the treatment plant at Annacis Island, where it is treated to be safe for disposal into the Fraser River, again charging us per cubic metre. Solid waste is slightly more complicated because organics, recyclables, and “garbage” go to three different streams, and some of those are costing us more than others.
The other costs are related to how we deliver those utilities. Salaries are pretty clear – that is what we pay people to do everything from performing repairs to pipes to processing your bills. Contractors also do similar tasks, but are usually related to projects like replacing a length of watermain under a street or designing a new billing system. You may note that Solid Waste has proportionally much more salary cost because we need people to drive around in trucks and empty your bins – Solid Waste is inherently more of a “service” delivered by people than one relying on capital sitting in the ground in the form of pipes. Supplies are the paperclips, toner fluid, and rubber gloves that staff need to do the jobs above. Note this category is limited to things that are consumed, as opposed to things like trucks and new pipes that are capitalized and included with our Amortization, but let’s not dig too deeply into the capital budget right now (I’ll talk about it more later) .
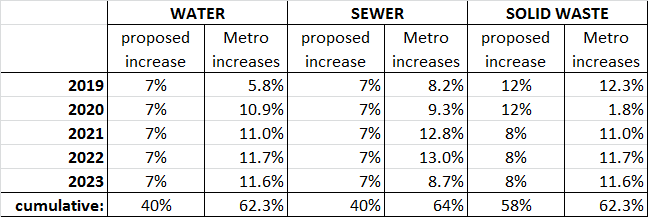
It is telling that 83% (water), 80% (sewer) and 62% (solid waste) of our expenses for these utilities are external, and for the two big ones, are going up much faster than the rate increases we are anticipating for the next 5 years:
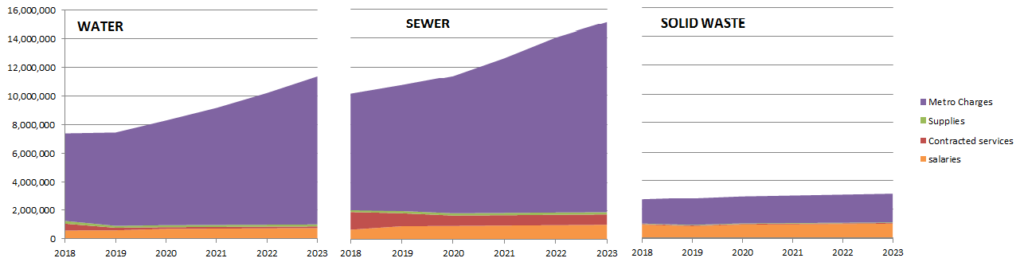
If we extend the pie charts above over the 5 years of the financial plan, we can see that not only are those external costs the largest portion of our costs, they are increasing at a much greater rate than the other expenses:
So utility rates are going up, because the main cost driver for the utilities are going up. What we can do about it?
Inevitably, someone is going to raise the issue of salary costs – it is unavoidable when talking about government. CUPE contracts that provide decent wages and work conditions, along with decent CPI-level wage increases won through collective bargaining, seems to elicit anger in some members of the public. However, public service wages are not a significant cost driver here, because they make up less than 10% of the cost for delivering utility service in the City. If we were somehow able to cut all salaries in half (those orange areas in the chart above), your utility costs would go down less than 6%. Such a drastic move would not even offset a single year of utility increases, and we would be back to regular increases in year two, with a much less effective utility due to the lengthy labour dispute and loss of staff.
Some will note that our “revenue” for utilities is much higher than our “expenses” for Utilities, and this is where we get to the other part of the equation: the capital budget. This is the money we need to re-invest into the utilities every year to keep them functioning, and to build towards sustainability. In the larger scheme, it is capital investment that explains why those Metro Vancouver rates are going up so much.
But that will have to wait until the next blog post…
Thanks Pat! Eagerly awaiting the next post about the why. I suspect we have a significant regional infrastructure debt (i.e., aging infrastructure) that needs urgent remediation. And if that’s the case, how much are the feds and province chipping in?
As usual, you go the extra mile to try to unpack stuff and that’s appreciated. I tend to get stuck in my head these days, worrying about those less fortunate. This at least shows a bit of where this comes from. Still frustrating and worrying though