The final election results are out, with poll-by-poll results. This gives us an opportunity to infer a bunch of things about the election. Note that this is more like reading tea leaves than defensible analysis, because anyone in the City can vote anywhere during a local election. We don’t know if the typical Queens Park Voter cast their vote at the Armoury, Glenbrook Middle School, or in an advance poll at the Lawn Bowling Club or City Hall. It is somewhat safer to assume mostly Queensborough voters voted in Queensborough, and the Pensioners’ Hall probably captured most of lower Sapperton, but where did Downtowners vote? There is a lot of fuzziness here, but here is a poll map: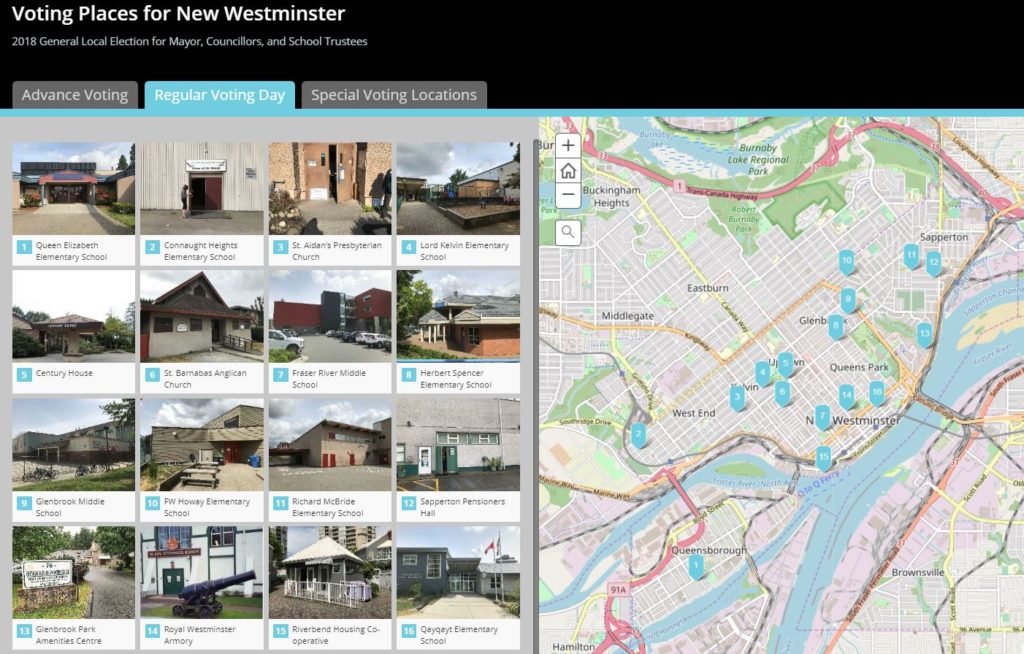
Messy data doesn’t prevent me (or some other local blogger) from trying to glean insight from it.
This table shows the poll-by-poll vote for City Council. I marked the winner of each poll in dark green, the second place in medium green, and the rest of the top 6 in light green. Orange is for the 4 people who finished just below the threshold: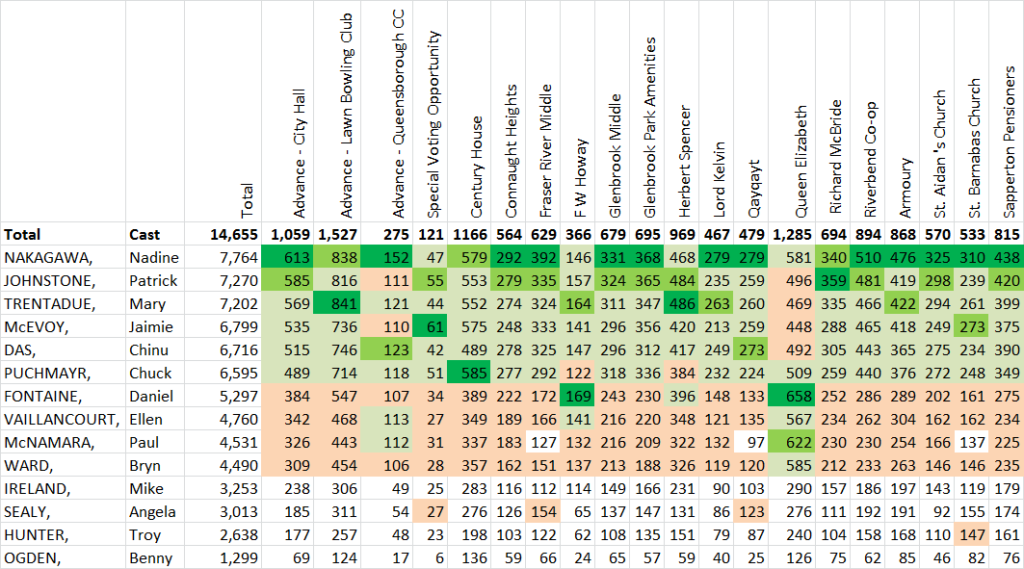
No surprise here that overall winner Nadine Nakagawa won the most polls with 13 – she not only won the popular vote, she won the Electoral College! She was also the only candidate to “place” (finish in the top 6) in all 20 polls. She dominated. Mary Trentadue and Daniel Fontaine each won two polls, with myself, Jaimie McEvoy and Chuck Puchmayr each winning a single poll. I had far and away the most second place polls, and all of those elected “placed” in between 18 and 20 of the 20 polls.
Team Cote candidates dominated almost every poll, except in Queensborough, and (arguably) Howay – the poll used mostly by Massey Victory Heights residents – where the New West Progressives (NWP) had a solid showing.
People paying attention to the campaign will have noticed that the NWP put a lot of effort into Queensborough, stoking some discontent around a few long-standing neighbourhood grievances, and benefiting from support of a small but vocal group of Temporary Modular Housing opponents. Team Cote members also did a lot of work in Queensborough (I personally knocked on hundreds of doors there), though we can look back now and say that the ~200 vote gap between the best NWP candidate and worst Team Cote candidate in that neighbourhood was hardly a factor in the overall election result.
For the fun of it, I looked at what percentage of their total vote each candidate received in the advance and special polls:
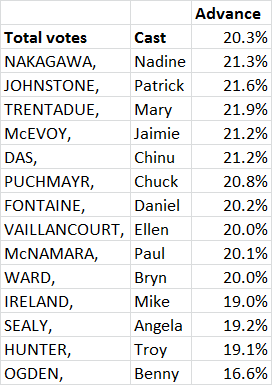
Interesting that Team Cote candidates received between 21% and 22% of our votes in the advance polls, NWPs around 20%, and others under 20%. I’m not sure if this relates to the relative get-out-the-advance-vote efforts, but it seems a consistent trend.
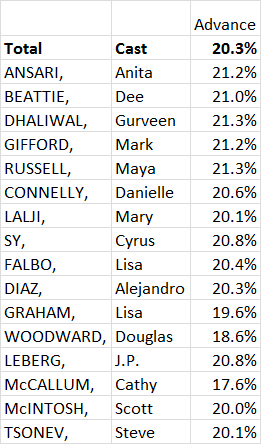
School Board data looks a lot like Council results, though perhaps a little more diffuse:
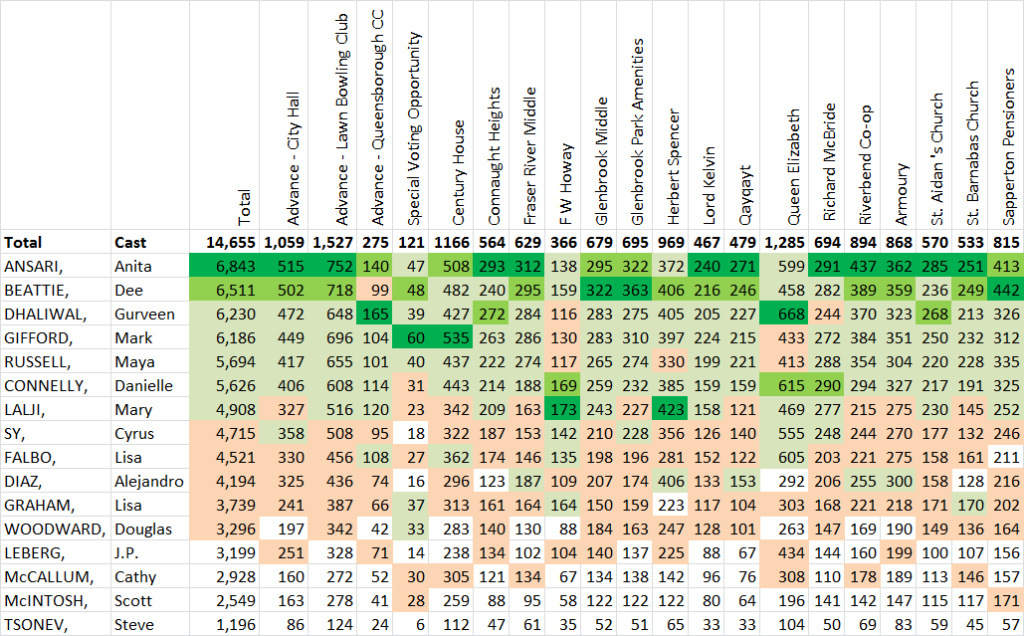
Overall winner Anita Ansari won 11 poll of the 20 polls, with Dee Beattie winning three and returning champions Mark Gifford and Mary Lalji each winning two. Queensborough resident Gurveen Dhaliwal won both polls in that neighbourhood. Beattie was second in most of the polls she didn’t win. NWP candidate Danielle Connelly didn’t win any polls outright, but did finish 2nd in three of them. Ansari was the only candidate to place in the top 7 in all polls, although Beattie only missed one (the Q’boro advance poll) as did Connelly (the Special Poll for hospitalized voters). Also note that the Team Cote candidates finished in alphabetical order – likely a coincidence, but fun to speculate about.
Mirroring the Council result, the NWP candidates did better in Queensborough than any other polling station, but also clearly had good success at the FW Howey poll in Massey Victory Heights, along with Mary Lalji. The standout among the others was Alejandro Diaz, whose success seemed to track along with Team Cote success better than the NWP, suggesting he was the most popular “6th vote” for those who voted the Team Cote ticket, where Lalji had stronger results where Team Cote did less well. Again, the Advance vote percentage closely mirrors that of Council:
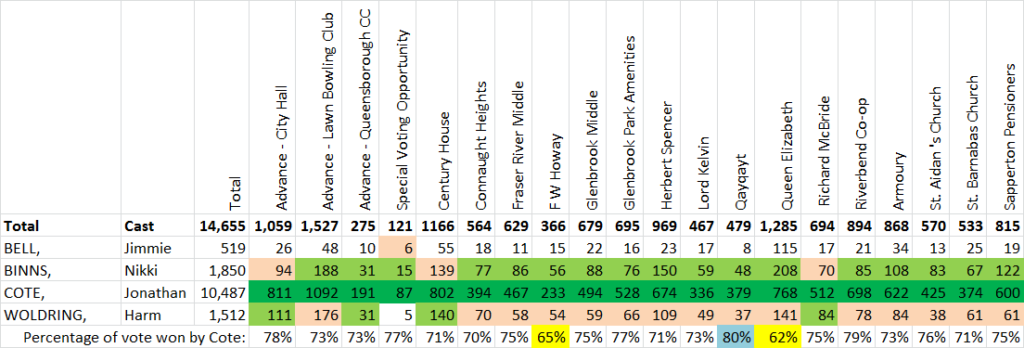
I’m not going to say to much about the Mayor’s race, because it was a blowout by pretty much any measure. Cote finished with less than 70% of the vote only in two polls (Queensborough and Howey), and won more than 80% in his own neighbourhood. Nikki Binns was clearly the second most popular candidate:
Outside of the statistical analysis, I am struggling to write a piece about “what it all means”. As someone who did well in the election, I don’t want to be seen as punching down in my analysis of why others didn’t do well. I have had a lot of conversations with different people since the election, and have heard a lot of opinions about the result. I am tempted read into New Westminster bucking the general regional trend of this being a “change election”, as seen in Port Moody, Vancouver, and Burnaby as a testament to the good work this Council has done, but getting out of my bubble a bit on this will be a challenge.
Bonus chart: Since I mention the quirk of the alphabet order of the top 5 in the School Board election, I thought I would do a quick scatter chart of election results and order the names appear on the ballot. Blue is Council and red is School Board (with best fit lines and R² provided by Excel):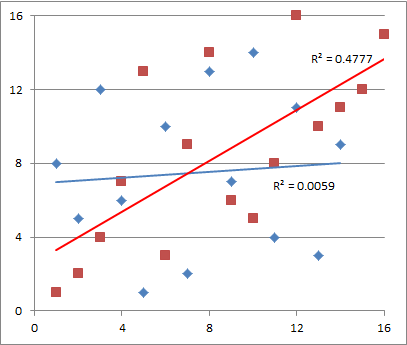
The Council result is close enough to random to be considered so, but you could convince me there is something going on here with the School Board ballot…