#NWELXN18 – a wrap

I have gone through the numbers of the recent election in a couple of posts, (here, here, and here) but I did so recognizing that I was perpetuating a trope that plagues democracy in North America (and perhaps the world?) – looking at politics like it is just another a sport. Line scores and a zero-sum-game of winners and losers are the easiest and laziest way to report on elections. It leaves little room for the more important discussions we should be having during an election: the debate of ideas and values and visions for the future.

I need to say that this has been a difficult blog post to write. There are a couple of 1,500-word drafts that have been deleted, because they all fell into the mode of being an us-vs-them analysis, and were more critical than helpful. I spent most of the last three months biting my (digital) tongue and not reacting to the messages of those who would have rather they be elected than me, because I wanted to avoid being drawn into a useless spat everyone would regret. It would serve no purpose (other than a little personal catharsis) to go there now.

**That said, I feel the need to stick one of my regular caveats here where I say all of this is my opinion, not the opinion of my council or election colleagues, City Council, the City, or any rational person or organization. If you disagree with me, let me know!**

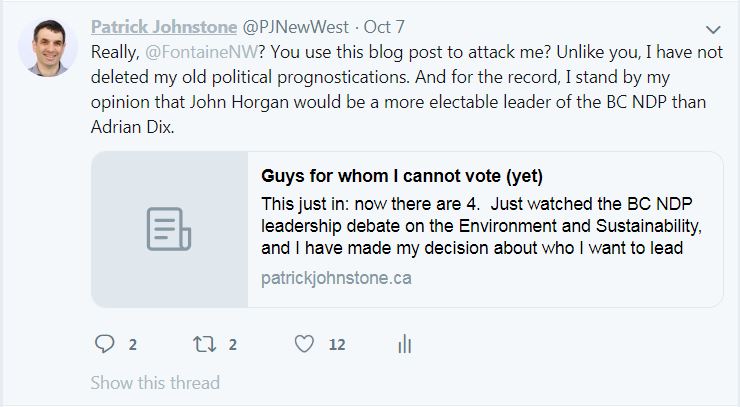
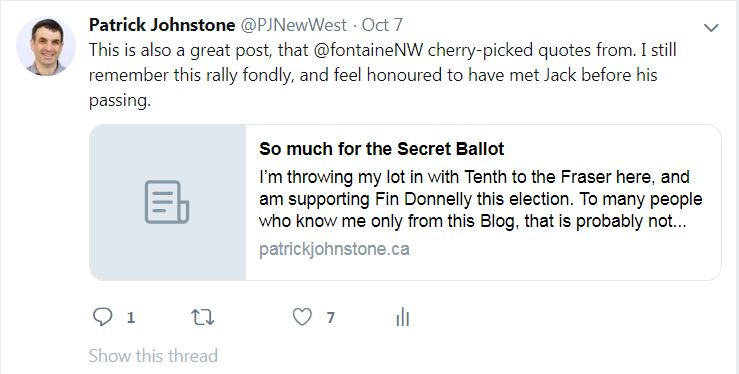
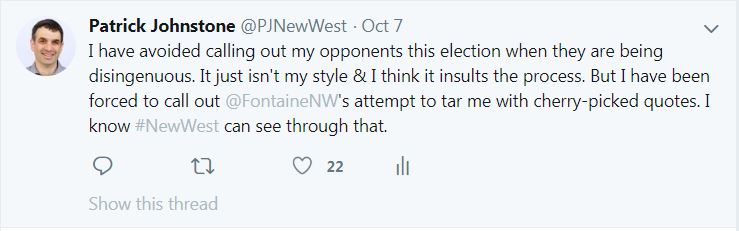
This slipped once during the campaign when I made a reference to Daniel Fontaine, in reaction to a pretty ham-fisted attempt on his part to demean me on his blog, using what I think was an appropriate amount of dismissive humour, but then following to point out how disingenuous the hit piece was:

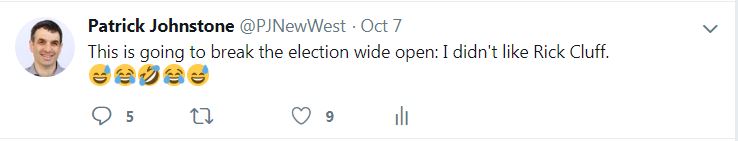
Trust me, the hardest part for me this election was not reacting to opponents on-line. There were many drafted-then-deleted tweets. Maybe I’m growing up.

But what was this election about? Other cities had clear narratives (Surrey wanted someone to deal with crime, Burnaby was about the need for housing, Port Moody about slowing the pace of development), but what was the New Westminster election theme?

After the fact and looking at the numbers, it is easiest for me to take the message that voters are generally happy with the way the City is being run, and were not as interested in change as in some of our surrounding communities. This reflected what I heard on the doorstep during three months of doorknocking, and what I heard in a thousand small conversations I had during the election. Things are not perfect, there are definitely things we could do better, but for the most part, things are headed in the right direction, and few are interested in a big shift in direction.

In the end, our main opponents must have heard that as well, and were challenged with messaging “things are mostly OK” along with the “time for a change” idea. In the end, they fell back on the familiar and tired narrative that New Westminster is run by organized labour in a poorly-defined but somehow nefarious way. This is the same narrative that James Crosty used to no success in New West for several elections, and the old Voice New West relied upon. Like running against bike lanes in Vancouver, this campaign message is exciting to a group of people in the City and gets amplified every election by the local media, but has never been one to motivate voters to come out and create a change. New Westminster happily votes for Labour-affiliated and NDP-affiliated candidates enough to elect them, and have done so in increasing numbers in every election for the last decade or two. This is why orange signs were a cynically good idea.

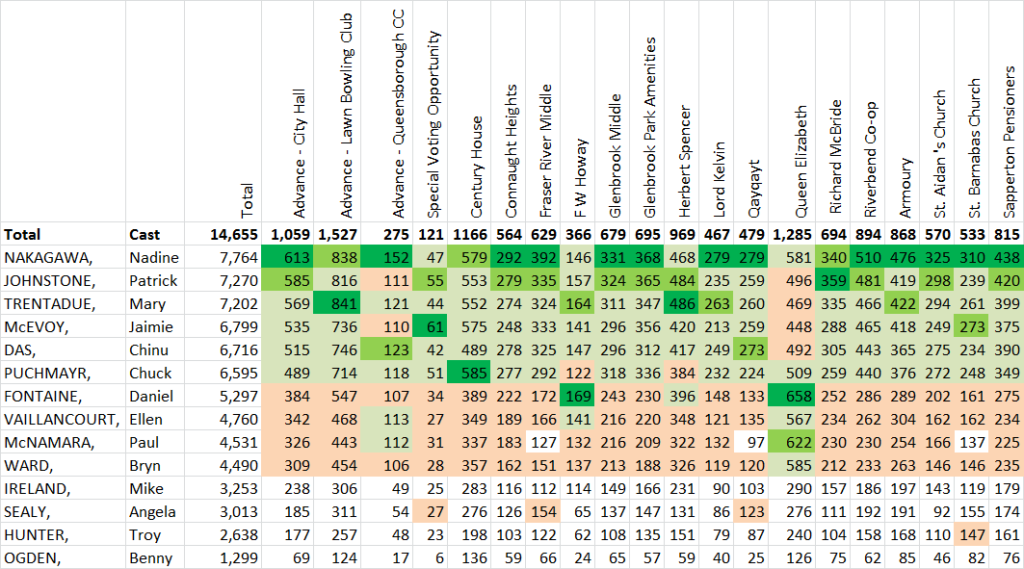
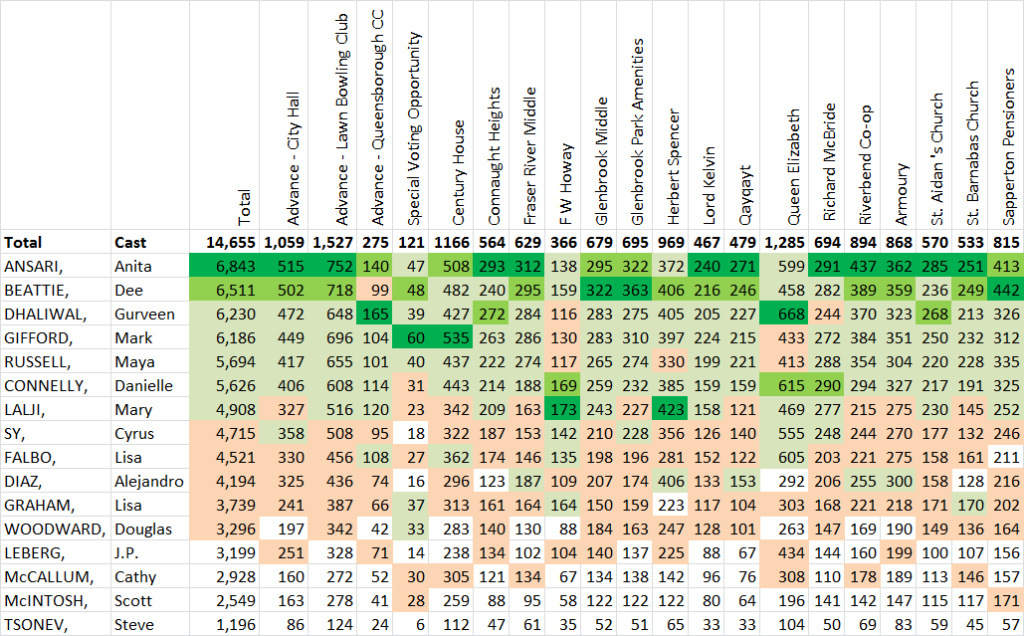
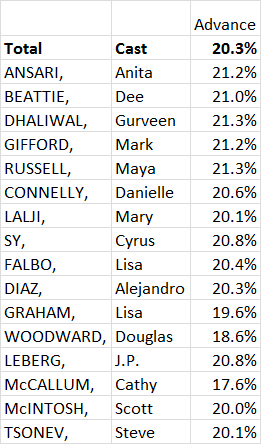
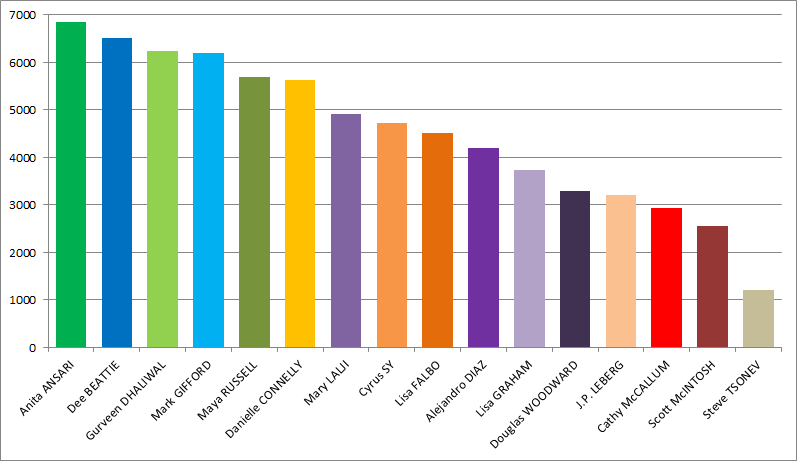
To the credit of my colleagues and voters, the winning candidates never stopped talking about the important issues to New Westminster – housing, transportation, inclusion and accessibility in schools, and livability of our community. They also worked hard to knock on doors and meet people. When I look at the new names at the top of the polls – Nakagawa, Ansari, Beattie, Dhaliwal – these are the candidates I saw out there every day earning votes with shoeleather and ideas. On election-period effort alone they earned every vote they got.

There was one big difference between this election and the previous one – the remarkable shrinking of the media space. Last election there were four (4!) local newspapers a week in New Westminster, now there is one. At the risk of poking those who buy ink by the barrel, there was not a tonne of coverage in the last few weeks of the election in the lone paper standing.

Since Labour Day (when the public starts properly paying attention to the campaign), there were a few news stories that announced the new candidates as they trickled out, a couple of pieces covering NWP messaging around how unfair the entire election process was, and not a lot else. The two substantial pieces were an October 4th quote-mining review of two All-Candidates Meetings (which strangely emphasized May Day as the biggest issue), and a really excellent 2-page spread on October 11th on diversity. However, through the entire election period there were no printed candidate profiles, not a single article discussing housing policy, infrastructure needs, transportation challenges, or any of the other top issues that might have informed voters about contrasts between what different candidates were offering. The final edition before the election (October 18th) had a single opinion piece admonishing people to vote, but no other coverage of the election or issues at hand. I don’t remember being asked a single election-related question by a single reporter between Labour Day and the close of the polls.

I recognize there are limited resources and limited column inches in one edition a week, and there was more material available on-line, but even that discussion was dominated by discussing the process of the election, with paltry discussion of policy issues. The emphasis on click-baity open-question headlines on Twitter and Facebook probably just worsened partisan bickering between supporters instead of actually inform on any issue. Indeed, here is where I missed the old Tomkinson-era Tenth to the Fraser that provided a really strong and well-curated online discussion. I suspect print is still more important to a significant number of voters than on-line content, and I can’t help but feel that the Burnaby Now side of the local Black Press Glacier Media office got a lot more attention, and their election got more column inches. Perhaps their election was more exciting.

So what now? The things I tried to talk about during the election are still my priorities after the election. We need to continue to improve how the City communicates and engages the public, and I want to have a serious talk with the provincial government on reforming the Public Hearing process. We are already leading the region in affordable housing policy, but have no intention of taking our foot off the gas, and will work to get new funding and new policy levers provided by the province (such as Rental Zoning) working for us locally. On transportation, I want to push a conversation forward about changing the culture in our roads. I want us to prioritize making vulnerable road users feel safe at all times. It is time for us to grow up and talk honestly about the goals of our transportation plan, which is not the destructive (and ultimately self-defeating) goal of “getting traffic moving”. 

Of course, I am just one of 7 on Council, and finding consensus on strategic plans for the next 4 years will be the main conversation for the next couple of months. Stay tuned!

#NWelxn18 – poll-by-poll

The final election results are out, with poll-by-poll results. This gives us an opportunity to infer a bunch of things about the election. Note that this is more like reading tea leaves than defensible analysis, because anyone in the City can vote anywhere during a local election. We don’t know if the typical Queens Park Voter cast their vote at the Armoury, Glenbrook Middle School, or in an advance poll at the Lawn Bowling Club or City Hall. It is somewhat safer to assume mostly Queensborough voters voted in Queensborough, and the Pensioners’ Hall probably captured most of lower Sapperton, but where did Downtowners vote? There is a lot of fuzziness here, but here is a poll map:

Messy data doesn’t prevent me (or some other local blogger) from trying to glean insight from it.

This table shows the poll-by-poll vote for City Council. I marked the winner of each poll in dark green, the second place in medium green, and the rest of the top 6 in light green. Orange is for the 4 people who finished just below the threshold:

No surprise here that overall winner Nadine Nakagawa won the most polls with 13 – she not only won the popular vote, she won the Electoral College! She was also the only candidate to “place” (finish in the top 6) in all 20 polls. She dominated. Mary Trentadue and Daniel Fontaine each won two polls, with myself, Jaimie McEvoy and Chuck Puchmayr each winning a single poll. I had far and away the most second place polls, and all of those elected “placed” in between 18 and 20 of the 20 polls.

Team Cote candidates dominated almost every poll, except in Queensborough, and (arguably) Howay – the poll used mostly by Massey Victory Heights residents – where the New West Progressives (NWP) had a solid showing.

People paying attention to the campaign will have noticed that the NWP put a lot of effort into Queensborough, stoking some discontent around a few long-standing neighbourhood grievances, and benefiting from support of a small but vocal group of Temporary Modular Housing opponents. Team Cote members also did a lot of work in Queensborough (I personally knocked on hundreds of doors there), though we can look back now and say that the ~200 vote gap between the best NWP candidate and worst Team Cote candidate in that neighbourhood was hardly a factor in the overall election result.

For the fun of it, I looked at what percentage of their total vote each candidate received in the advance and special polls:

Interesting that Team Cote candidates received between 21% and 22% of our votes in the advance polls, NWPs around 20%, and others under 20%. I’m not sure if this relates to the relative get-out-the-advance-vote efforts, but it seems a consistent trend.

School Board data looks a lot like Council results, though perhaps a little more diffuse:

Overall winner Anita Ansari won 11 poll of the 20 polls, with Dee Beattie winning three and returning champions Mark Gifford and Mary Lalji each winning two. Queensborough resident Gurveen Dhaliwal won both polls in that neighbourhood. Beattie was second in most of the polls she didn’t win. NWP candidate Danielle Connelly didn’t win any polls outright, but did finish 2nd in three of them. Ansari was the only candidate to place in the top 7 in all polls, although Beattie only missed one (the Q’boro advance poll) as did Connelly (the Special Poll for hospitalized voters). Also note that the Team Cote candidates finished in alphabetical order – likely a coincidence, but fun to speculate about.

Mirroring the Council result, the NWP candidates did better in Queensborough than any other polling station, but also clearly had good success at the FW Howey poll in Massey Victory Heights, along with Mary Lalji. The standout among the others was Alejandro Diaz, whose success seemed to track along with Team Cote success better than the NWP, suggesting he was the most popular “6th vote” for those who voted the Team Cote ticket, where Lalji had stronger results where Team Cote did less well. Again, the Advance vote percentage closely mirrors that of Council:

I’m not going to say to much about the Mayor’s race, because it was a blowout by pretty much any measure. Cote finished with less than 70% of the vote only in two polls (Queensborough and Howey), and won more than 80% in his own neighbourhood. Nikki Binns was clearly the second most popular candidate:

Outside of the statistical analysis, I am struggling to write a piece about “what it all means”. As someone who did well in the election, I don’t want to be seen as punching down in my analysis of why others didn’t do well. I have had a lot of conversations with different people since the election, and have heard a lot of opinions about the result. I am tempted read into New Westminster bucking the general regional trend of this being a “change election”, as seen in Port Moody, Vancouver, and Burnaby as a testament to the good work this Council has done, but getting out of my bubble a bit on this will be a challenge.

Bonus chart: Since I mention the quirk of the alphabet order of the top 5 in the School Board election, I thought I would do a quick scatter chart of election results and order the names appear on the ballot. Blue is Council and red is School Board (with best fit lines and R² provided by Excel):

The Council result is close enough to random to be considered so, but you could convince me there is something going on here with the School Board ballot…

#NWELXN18 – THE TRENDS

One of the discussions during this election (and in all local elections for the last few decades) was voter turnout. Already low across the region, there was some concern that this election would see even lower than usual turnout. We don’t have official numbers yet, but I thought it would be good to compare this year to previous years.

There was some reason to suspect lower turnout this year. As charming and important as School Trustees and City Councillors are, it is really difficult for normal people and occasional voters to connect with that level of government. Occasionally, we have a candidate who is really compelling (I think of Jonina Campbell in 2011, Kelly Slade-Kerr in 2014) who drive some increased interest, but I doubt even that draws more than a couple of percent of eligible voters. Much like federal election interest is driven by the candidates for Prime Minister (sorry, Peter), the reality is that local elections often carry the weight of the Mayor’s race. And the reality is we didn’t have much of a Mayor’s race this year. Nothing against the challengers, but they all started very late and had limited campaigns (only one had lawn signs, one other had a website, and attendance at all-candidate events was spotty). I think in most people’s minds, even those who opposed him, Cote as a safe bet to win.

However, there was also a reason to suspect turnout may be higher, and that was a well-coordinated and -funded party running in opposition to the existing Mayor and Council. There is good potential for a party with strong political connections and good messaging to drive turnout, both by their own efforts, and by forcing the incumbents to get off their duffs and work to keep their jobs. I knocked on almost as many doors this year as I did in my rookie year, and direct voter engagement – actually looking at people and telling them to vote – is the proven Get Out The Vote strategy.

So how did that all work out?

A note here, I am using the unofficial voter stats released by the City for 2018, and the City’s open data number for previous elections (we don’t yet have official numbers for 2018). I am also using population stats from the BC Government website. These numbers are not “voter turnout” in any official way. New Westminster’s population is about 74,000 people. We had just under 50,000 registered voters going into the election, though some of those people may have died, moved out of the city, or otherwise not been eligible to vote this election. There were probably a fair number of people who were eligible to vote but were not registered to do so, and registered on the day of the election. Short story: numbers are complicated, and everything below is an estimate.

This graph shows the number of votes for Mayor, Council, and School Board for every election since 1990 (the first year these stats are provided by the City), alongside the population trend for the same period:

As the numbers are hard to compare on a single y-axis, I indexed all of them by dividing all of the numbers by their 1990 value to allow a closer comparison. Numbers below 1.0 are lower than the 1990 value, numbers above 1.0 are above the 1990 value:

Finally, to see how the vote numbers compare to population change, I divided the Mayor’s vote count by population, and the Council and School board votes by population *and* by dividing them by the total number of available votes (6 for school council, 7 for school board). See the above caveat about this not being “voter turnout”, but it does provide a clear indication of how voter number change when population change is removed:

In short, voter turnout dropped in the late 1990s, turned around in the early 2000’s, and took until 2014 for it to catch up to the losses of the previous decade. 2018 turnout is slightly down in 2018 for Mayor and Council, and slightly up for School Board when compared to 2014.

This does show the importance of the Mayors Race. In 1999, the Mayor was acclaimed, and the School Board and council vote turnout suffered. The 2002 Election was an exciting affair with Wayne Wright unseating the incumbent by 18 votes, resulting in a jump in voter turnout across the board. The next three elections were relatively lackluster as a popular mayor won fairly easily, and the Council and School Board vote more or less flat-lined. (the 2008 School Board jump possibly related to the Grimston Park school controversy? Or am I getting my dates mixed up?). 2014 was again an exciting mayoral race with a strong-campaigning challenger unseating a popular incumbent. And much as I would think I am responsible for the huge jump in Council votes that year, the turnout across the board (if not my lackluster 5th place finish) belies this hope.

One thing that does stand out is uptick in School Board votes this year while Mayoral and Council votes were slightly down (on a per-capita basis). I would love to hear a theory to explain this. Good candidates? The fact they are finally pouring concrete for a new High School? Or perhaps it was because no group ran a full slate, so there was seen to be more room for challengers to get onto the board? Enter your theory here.

Poll-by-poll results are yet to be released, and that is where the real fun is! I will write another piece once I get a chance to chew on them.

#NWelxn18 – first the numbers

That was interesting!

I have avoided talking too much about the election over here, relying on my election website to carry the campaign load while I kept this site on the day-to-day of council life. However, I am going to spend a bit of time between now and the resumption of Council stuff in November looking back at the election.

I am still thanking my many volunteers and supporters, the feelings are still a little raw, and lots of Monday morning quarterbacking is going on, so I am going to hold off on all that stuff for a bit and start with just the (preliminary, not yet official!) numbers, starting with number of votes:

On Council, Team Cote clearly dominated, not only taking the top 6 spots, but doing so with a clear numbers gap over the members of the NWP Party (6th place had 25% more votes than 7th place), who in turn had a pretty solid gap ahead of the 4 independent candidates (10th place had 38% more votes than 11th).

Voting percentages are a little wonky for Council elections because we don’t know how many votes each voter decided cast, but there were 71,627 council votes and 14,368 votes for Mayor, so we can infer an average of 5 votes per voter. There were something like 50,000 registered voters in New Westminster, so turnout it tentatively a little over 28%, about the same as last election (the exact numbers will have to wait until the official report- as we don’t know how many voters registered on the day of the election) .

The pie chart allows a little more clumping analysis. We can see that Team Cote candidates earned 59% of the vote total, NWP candidates 27%, and others 14%. Of course, there were 50% more Team Cote candidates than the others, so perhaps a better comparison is that the average Team Cote candidate earned 9.9% of the votes, the average NWP candidate 6.7%, and the average Other 3.6%.

Nadine Nakagawa surprised even herself by dominating the vote. The last time a rookie candidate led the polls for Council was in 1996 when a young Jerry Dobrovolny pulled off the feat. The vote count of all 6 elected Councillors (7,764 to 6,595) is quite a bit higher than last election (6,262 – 5,517), though the vote count for the 7th place finishers is not that different (5,297 in 2018, 5,165 in 2014).

For the fun of it, I made a bar chart mixing this year’s election results (blue) with last elections (in red) so you can get a sense of how the vote distribution changed:

There were more candidates in 2014, which makes for a longer tail on the distribution, but this display really makes the gap between Team Cote candidates and others stand out – getting about 20% more votes than their cohort in the previous election, where the NWP had very similar vote counts as their 2014 cohorts. This was a convincing win compared to last election.


On the School Board side, things are not as clear. The Team Cote candidate still swept the top spots, but the vote count was much closer:

There also isn’t a big gap between 7th place (and elected) and 8th place (less than 4%). The NWP candidates were not clustered, it is clear there was no “block vote” for or against the NWP. Danielle Connolly got 25% more vote than the NWP average, J.P.LeBerg got almost 30% fewer votes than that average.

The average ballot included 5 Trustee votes (72,335 compared to 14,368 for Mayor, see assumptions above) – curiously the same average as for Council even with one more opportunity to vote, and they broke down like this:

43% of the votes went to Team Cote candidates, 25% to NWP candidates, and 32% to others. Again, since there were different numbers of candidates in those three clumps, the better estimate may be that the average Team Cote candidate earned 8.7% of the vote (and all were pretty close), the average NWP candidate 6.2% (with a wide spread), and the average Other 4.5% (with two candidates standing well above the average).

The comparison between 2014 and 2018 is more interesting here than with Council. There were more votes in 2018 (about 14% more), but in contrast to Council, less of that vote went to the front-runners. With more candidates in 2018 the distribution is more spread out, but it will take a smarter political scientist than me to tell what this means!

Finally, in a campaign where there was much discussion of how diversity was defined, all of the new candidates elected were women – three on City Council and six (6!) to the School Board. This, and the cultural diversity of the candidates, may be historic for New Westminster. Though it is worth noting that between 1993 and 1996, there were three women on New Westminster Council, and Betty Toporowski was Mayor. Whether a person of colour has ever served on Council in New Westminster is the kind of question you would need to ask an historian.

Ask Pat: Smoke and edibles.

DB asked—

The bylaw regarding Cannabis Regulations No. 8043, 2018 has a section saying retail shops cannot sell edible cannabis. I live in an apartment in New West that has a strict no smoking/vaping policy (which I am very happy about). Edible Cannabis is a work around for situations like mine – unless it will be legal to smoke on the streets (which I am assuming is not the case). I understand it has been adopted but, I still wanted to voice my opinion on it.

That was not strictly in the form of a question. But I’ll take a stab at it.

We are one day away from the legalization if cannabis in Canada, and all three levels of government have been scrambling to get a regulatory regime together. It is a challenge – this an unprecedented change in the regulation of a psychotropic drug. From a local government side, we needed to put together zoning and business bylaws to support the operation of the stores that coincide with the model that the province put together. We also have to think about the inevitable nuisance complaints we are going to receive around the legalization of what is, for all its alleged benefits or harms, a pretty stinky substance.

On edibles, our Bylaw is designed to parallel the federal regulations. There will be no legal edibles sold in Canada in 2018. I suspect this is related to a myriad of packaging and labeling concerns, and addressing the risk to children when sweets and drinks are made containing the psychoactive elements found in cannabis. There is some suggestion that they will address this in 2019, but until then, dried product intended for smoking is the only legal form of recreational cannabis.

Your point about Strata rules prohibiting the smoking of cannabis is definitely a concern. With the existing prohibitions around public smoking – no smoking in parks, in bus stops, 7.5m from the door to any public building, or inside any business or public building – you are right that there will be limited places where it is legal to smoke cannabis. Unlike alcohol, you will not be able to go to a business (like a pub or coffee shop) to smoke, but you will be able (as best I can tell) to smoke on the sidewalk or the street, as long as you are not within 7.5m of a door or air intake. Still, if you are restricted from smoking at home because of strata or rental rules, your opportunities are really limited. This creates a fundamental unfairness – this completely legal product will be inaccessible to some.

I honestly don’t know how to address this and remain compliant with the various laws at all three levels of government. If you have the skills, I suppose you could bake your own edibles using the dried product meant for smoking (I don’t think that would strictly be illegal, as long as you don’t sell the baked goods). Or you can wait until the federal government gets the edibles part figured out. The transition to this new regime is going to be challenging for several reasons.

As a city, we tried our best to put together a comprehensive set of regulations. We had a few workshops with Council and staff, and heard from the public and stakeholders in the industry. After some pretty challenging debates around what the limits should be, we settled on what will no doubt be an imperfect regime, but we will learn as we go along. We will be ready to accept applications for cannabis retailers as soon as legalization occurs on Wednesday, but as the process to get a store approved and operating may still take several months, don’t expect to be buying cannabis in New West until early in 2019.

Update: Time between the legalization of cannabis and the first e-mail complaint received by Mayor and Council abut having to smell the smoke in a public place: 16 hours.  

Ask Pat: Dark Fibre

Jenni asks—

Will the dark fibre network also be connected to older buildings or just new builds?

Short answer is yes, the BridgeNet fibre network can be connected to old buildings and to new builds.

The City of New Westminster is investing in a so-called “dark fibre” network. Hardly as ominous as it sounds, this means we are installing conduits in the ground under our roads, and are putting optical fibre in those conduits. We are not putting light through that fibre (hence the “dark” moniker), but are leasing the rights to light up the fibre to Internet Service Companies (ISPs). We invest in putting fibre in the ground, they pay us to use it. They then sell you (be you a resident or a business) the data connections that are made available. I wrote a little more about it a couple of years ago here. 

The end result for residents and businesses in New Westminster is that they can go to one of the (now 7) ISPs who are leasing BridgeNet fibre and get higher speed internet service than the Big Telecoms are willing to offer in New Westminster. This increase in competition also means your internet (and TV and phone) service may be offered by these ISPs at more competitive rates. Faster internet for less money: that is the goal.

Of course, there are devils in details. We are currently still installing fibre, and it will be a few years yet until all of the major development corridors throughout the city are connected. The “last yard” gap between the fibre and your computer mean that it is multi-unit buildings where the ISPs are concentrating their energy right now in getting hooked up. We have also been working with ISPs to provide specific boutique services to different business sectors, such as higher-cost service to tech businesses that need a really big pipe to move a lot of data, and are willing to pay for it.

There are currently no plans that I am aware of to bring fibre from the BridgeNet Network to single detached home neighbourhoods. The economics are just not there for the ISPs to make that service viable, though there are some interesting delivery models around line-of-sight over-the-air delivery that may make the datarate/cost calculations work out for tat type of service eventually. However, there is nothing preventing older multi-unit buildings from working with one or more of the ISPs to put a junction box in their telecom room, and making the service from that ISP available to their residents or business owners.

Again, the Cit’y role here is to provide the fibre to ISPs and charge them for its use, when it comes to providing retail service, you are best to contact the ISPs directly (or through your Strata Council or Building Management Company).

Ask Pat: Two projects

In the spirit of getting caught up, Here are two Ask Pats with similar answers: “I don’t know”.

mmmmm beer. asks—

I appreciate the transparency your blog offers. I just have a quick question. What ever happened to the Craft Beer Market that was supposed to go in at the New West Station. Is that still moving forward?

Shaji asks—

Firstly, thank you for getting back to me on my question about Frankie G’s ????
Secondly, there are many of us residents at the Peninsula and Port Royal in general wanting to inquire about the plans for the Eastern Neighbourhood Node. I know there were some extensive discussions and planning sessions between the City and Platform Properties. We also have noticed that some ground preparation work has started. Any updates that you can share on what work has started, what are the prospects and what are the timelines for this project. Thanks ????

Yes, the answer to both of these questions is “I don’t know”.

The Craft Beer Market was a proposal that came to Council for a Development Permit back in July of 2016, and was proposed for the empty lot across from the Anvil Centre at Eighth and Columbia. You can read the report starting on page 348 here. It was brought to Council as a Report for Information, and the next steps were to be Design Panel review and some public consultation, then staff would bring a Development Permit bylaw to us for approval or rejection. I remember the conversation about the proposal being generally positive (see the Minutes of that meeting, Page 13 here), but we have not, in my recollection, seen any further reports.

The Eastern Neighborhood Node that would connect Port Royal to the rest of Queensborough with a mix of residential and commercial property has been the subject of several meetings. The most exciting part of the proposal (and the part that led to some discussions around the layout of the site ans stage of development) was the allocation of some 50,000 square feet of neighbourhood-serving commercial. This would bring (it is hoped) a small grocery store a some basic services to the booming Port Royal community. There would be some land assembly required, as (again, to the best of my knowledge), the developer does not own all of the land required to make the development work, and some pretty significant utility and drainage engineering needs to be done to support the development.

Both of these speak to how complicated development can sometimes be, and to the fact that Council is not directly involved in some of what makes development happen or not happen in the community. We can, obviously, say “no” to a development proposal that requires variances or zoning changes, but once we say “yes” to a development we really can’t force the developer to build. Even the “yes” we give a developer does not typically contain a timeline to completion. As plans are developed, construction costs are calculated, compromises are negotiated, and market forces are navigated, sometimes the math ends up not working out for the proposal we see at Council, and it never happens. Commonly, those things occur in a way that Council would never see. If there is no decision for us to make, no plan or change of plans for us to approve, we are most likely in the dark about the details of what is holding the situation up.

Both of those proposals have some very public-facing companies involved. They may be able to answer your questions better than I can. As a general principle, I think getting retail happening on the eastern end of Queensborough and that empty lot at Eighth and Columbia activated would be great things for the City, and for our residents. I don’t know how I can make either happen faster than the landowner plans to invest. I can tell you that there is no action that I know of that Council has taken to slow down either proposal.

Ask Pat: Bent Court

I have been tardy on Ask Pats. I have this other project going on, and have taken the Ask Pat thing analogue a bit to reach more people. However, there are a few in the queue here, and I am going to spend a bit of my Thanksgiving weekend trying to get caught up. Enjoy!

Chris asked—

Hello,

In an archived memo back in 2016 you posted this regarding the future study of Bent Court.

Bent Court: This area is interesting, a mixed residential and commercial district that is zoned for high-rises, although it is unlikely that anyone would build to that scale here. Staff is recommending a special approach here that can incentivize the preservation of the heritage homes, whether they be used for residential or commercial.

Can you help clarify why it is unlikely that ” anyone would build to that scale here”

Bent Court is a bit of an anomaly. The comment you hearken back to was part of the OCP discussions, where we recognized a few areas in the city that didn’t fit into a bigger area-wide picture very well. The West End and Massey Victory Heights are pretty internally homogeneous, but areas like Lower Twelfth Street and Bent Court are not easily defined, nor is it clear what land use will be most successful there.

Bent Court is mostly a collection of heritage-aged houses, many of them converted to some sort of commercial use. They are immediately adjacent to the uptown commercial area, but also serve as a buffer to the residential areas of Brow of the Hill. There is currently one project being (slowly) built on this site where a heritage house is bring preserved and a 6-story residential building is being built. Even they project caused us some challenges, as determining what a full compliment of parking should be for an area like this that is walkable, but not that close to SkyTrain is a difficult estimate. Street parking can sometimes be at a premium, but many of the apartment buildings nearby have largely underutilized parking. Alas… parking…

My thought in that statement about building to full high-density at Bent Court (in C-3 Zoning, this means Floor Space Ratio of over 5, mixed-use commercial at grade, residential above) was my own feeling that the economics and difficulty of assembling land to make it happen make it unlikely in the current market. Each of the lots is worth more than $1 Million now, to build to the scale of the adjacent mixed-use towers, one would have to assemble a dozen properties. Some (or most) of these properties have some potential heritage value (which adds some uncertainty to the approval process), and are currently returning commercial lease rates that make them economically viable as they are.

That said, there is a lot of development going on right now across the region, and I am not a land economist, so I may not be reading the market well. Not long after I wrote that statement, a real estate company put signs up suggesting land assembly and high rise development are viable options. That doesn’t mean it is going to happen, nor has there been an application for any kind of rezoning or development permit arrive at Council, nor is it clear how staff, Council, or the community would approach such an application. A Bent Court Area Study is planned for 2019 as part of the ongoing OCP Implementation Plan, and this will provide a little more robust economic analysis than my speculations above. Stay tuned, because there will no doubt be opportunities for community input at that time.

I could imagine Bent Court as a pretty special place. Co-op ownership, preserve the heritage houses, convert them to live/work units where artists can set up studio space and live on their studios, add a few food and drink opportunities and some clever marketing, and it could become a unique mini-artisan village of regional importance. However, one doesn’t have to be a land economist to recognize at a million dollars a lot, it would be neigh impossible to make this work unless one had small fortune to dig into… any patrons out there?

Council – Oct 1, 2018.

Final! Council! Meeting! Of! The! Term!

The election is reaching fever pitch, but some of us still had some work to do. The final council meeting included some time to reflect on the careers of retiring councilors Lorrie Williams and Bill Harper. I will talk more about that in a future blog post, because we also had a full agenda:

The following items were Removed from Consent for discussion:

Public Engagement Strategy Update
The City’s Public Engagement Taskforce created a strategy to improve how the City engages its residents and stakeholders in planning and decision making. We are a year into implementation, and have already achieved some of the short-term tasks like creating a Public Engagement staff position and developing a toolkit for all departments in the City to use in their own engagement. There is much work to do, however, and this report lays out our approach to the medium- and long-term tasks.

Council Approval of Future Forward: An Economic Development Plan for New Westminster 2018-2023
Similarly, our Economic Development plan has taken almost two years to put together with extensive public and business community consultation. One of our great advantages in New Westminster is our collaborative relationship with our BIAs, with our Chamber of Commerce, and with other business groups like the New West collective and the Tech meetup. Getting business leaders in the City involved in the development of this strategy means we avoid the top-down approach that overlooks the local element. I’m looking forward to seeing this plan implemented, leveraging the advantages of the RCH expansion and the new regional buzz New Westminster is experiencing>

Proposed 2019 Schedule of Regular Council Meetings
This schedule shows a slightly reduced number of meetings compared to 2018. We had a bit of discussion about this, because we have had issues this year with extremely lengthy agendas, and fear that some of the items are not getting the fulsome review that is ideal. That said, meetings are expensive – they take a lot of staff time and resources, and that is time not being spent doing the other things staff have on their busy schedules. We need to strike a balance.

Ultimately, I hope we can schedule a couple more daytime workshop meetings. We had great success this term with workshop format meetings on complex issues like the Heritage Conservation Area and cannabis regulations. We were able to debate, disagree, express our concerns and work with staff towards consensus. They were the most satisfying part of my Council experience, as they gave us a change to dig into policy implications of our decisions. Though we may not be able to predict what new strategic direction the new council will take, and therefore what the workshop topics will be, I hope to continue that trend.

New Westminster Food Security Action Plan (October 2018): for Information
About 10% of New Westminster adult residents are at some time of the year food insecure. The City has been working with stakeholders and service agencies to help address this issue in the City as part of our larger anti-poverty strategy. Some will argue this is outside of the mandate of local governments, and indeed we are not the lead on this policy, but we do have a role in supporting the agencies who are experts at this work.

813 – 823 Carnarvon Street: Housing Agreement Amendment Bylaw for Three Readings
We have occasionally failed in the past to manage parking provisions in some affordable housing/ market housing development, and this is currently causing quite a bit of conflict in one community in the City. As we work on that legacy problem, we need to assure we are not repeating the mistake, and make it clear to developers who are receiving development benefits in exchange for including affordable housing what the expectations are for parking, secure cycle storage, and general storage in those developments so that the people in the affordable housing portion are not nickel-and-dimed out of affordability.

Q to Q Pilot Ferry Service – Update and Extension of Pilot
This report is good news. The ridership of the QtoQ Ferry is good enough (65,000 rides!) that it warrants an extension through the winter to determine if it is viable not just as a summer cruise, but as a transportation link.

There are some details in here about challenges. One is determining how to make the waiting areas at each end more customer-friendly and less impactful on neighbours through signage (cues to help the QtoQ queues), and another is the challenge of Compass Card integration. We also need to get a long-term business plan together to decide what the best structure is for a permanent service if the winter ridership supports this.

In the short term, we will continue running the QtoQ until May at the least, and will adjust the schedule somewhat to reflect expected off-season use patterns. Staff and the operators will continue to talk to the users to make the schedule as useful for those users. Ultimately, we need ot make this link work for them if we are going to make the case for long-term investment in the ferry service.

New Westminster Urban Solar Garden – Next Steps on a Second Array
Phase 1 of our Solar Garden is installed n the Queensborough community Centre roof, generating electricity, and paying back the investors (including me!). There is still public demand, so we are moving forward with Phase 2, likely to be located at the works yard in Glenbrook North.

Recruitment 2019: Youth Advisory Committee (YAC) Appointments
The Youth Advisory Committee has a different schedule than the other Council Advisory Committees, because we try to synch it to the school schedule. The 2018-2019 edition of the YAC is now struck. There is room for a few more members of the New West youth community – if you know someone between the ages of 13 and 19 who might want to tell City Council how to do or job better, send them here.


The following items were Moved on Consent:

Users Fees and Rates Review Amendment Bylaws for 2019
Every year we review our various fees as part of our budgeting process. Almost all of them go up with CPI (“inflation”), but we also review them to assure we are recovering costs and to match with the fee structure in adjacent communities.

In summary, Engineering fees going up 2% to match CPI, Business Fees, building fees and Planning fees will go up 2% with a couple of small exceptions (we are in the bottom 25% of Lower Mainland municipalities on these fees). Cultural Services fees are doing the 2% thing, and the fees we charge Lawyers and Notaries for tax records and other filings are going up more than 2% to align with regional averages.

Due to CPI adjustments, the business licence rate for a Tea Cup Reader is now $47.87 per annum. I expect the Tea Cup Readers saw this coming, and have already raised their rates accordingly.

Investment Report to August 31, 2018
The City has about $180 Million in the bank. Much of this is in reserve funds – money we have put aside for specific purposes (like the CGP replacement and DCC funds that must be used to expand utility capacity concomitant with population growth). We have drawn this down a bit over the last year, as we are spending it on the things it was saved for, like sewer separation in Sapperton and the Ewen Street project.

This is our regular report on the return we are making on investments. As a City and for statutory reasons we are very low risk in our investment strategy, but the bond market is flat right now, so our finance department has moved some money to secure savings accounts. About 2/3 of the way through our year, we have reached about 66% of our budgeted return on investments. We will likely make about $2.3M in investment income this year.

Major Purchases May 1st to August 31st, 2018
This is our ternary report on what the City purchased through sole source or public procurement. We are required by law to have an open bid process for most purchase and use BC Bid to do that purchase. If you bidded on a job at the City, and didn’t get it, here is where you can see who got the job and how much we paid them!

406 – 412 East Columbia Street: Development Permit – Issuance
This mid-rise mixed-use project on a vacant lot in Sapperton has been through extensive review and public consultation, and is now at the Development Permit stage. This is an exciting new landform for Sapperton, mixing commercial,retail and residential, and bringing a bit of new energy to East Columbia. I am happy to support it.

811 – 819 Twelfth Street and 1124 Edinburgh Street: Heritage Revitalization Agreement for Six Storey Residential Building – For Information
This is a preliminary report: Council’s first view of a proposed project in Twelfth Street before it goes to internal reviews and public consultation. There is a lot going on here: passive house standard multi-family 6-story building, four more “missing middle” units, lots of family-size units, and a heritage house preserved as a transition to the adjacent residential neighbourhood. Coming soon to a public consultation near you!

837 – 841 Twelfth Street: Rezoning and Development Permit for Six Storey Residential Building – For Information
This is also a preliminary report for a project right next to the above one. It is a little more straight-forward in being all residential. This will no doubt raise some discussion about the role of residential at grade and retail along the Twelfth Street corridor. Coming soon to a public consultation near you!

466 Rousseau Street (Urban Academy): Zoning Amendment Bylaw Text Amendment and Amendment to Development Permit – For Information
Another preliminary report. This is unprecedented in my time on Council, an application to expand the capacity of a recently approved building during its construction! There will need to be some review and public consultation here!

310 Salter Street (Port Royal): Development Permit and Development Variance Permit Application for Four to Six Storey Residential Development –For Information
This is one more – and almost the last – piece in the Port Royal development. It needs to go through DP and some variances for setbacks. Again, a preliminary info report with lots of review and public consultation to do!

268 Nelson’s Court (Brewery District): Development Permit Application for a High Rise, Mixed Use Development – For Information
The next phase of mixed-use development in the Brewery District is ready for the Development Permit stage. At the LUPC, there was a bit of push-back on the level of amenity (specifically, provision for child care) with this development, given its size and scope and the concerns raised in the community the last time the scale of this development was reviewed. (note – this does not include an increase in height or stories over the previous application)

This is a preliminary info report – lots of review and public consultation to do!


We also had a raft of Bylaws to read and adopt:

Tree Protection and Regulation Amendment Bylaw No. 8052, 2018 and Development Services Fees and Rates Amendment Bylaw No. 8053, 2018
These Bylaws that support the recent changes in how the Tree Bylaw is administered were given second and third readings by Council.

Engineering User Fees and Rates Bylaw Amendment Bylaw No. 8058, 2018;
Fees Amendment Bylaw No. 8059, 2018;
Cultural Services Fees and Charges Amendment Bylaw No. 8060, 2018;
and
Development Services Fees and Rates Amendment Bylaw No. 8061, 2018
These Bylaws that support the fee changes described above were given three readings.

Housing Agreement (813 – 823 Carnarvon) Amendment Bylaw No. 8056, 2018
This Bylaw that outlines the requirement for the affordable housing component of the approved development on Carnarvon Street was given three readings.

Taxation Exempt and Exempt Properties Bylaw No. 8054, 2018
This Bylaw that formalizes the properties exempt from property taxation was adopted by Council.

Five Year Financial Plan (2018 – 2022) Amendment Bylaw No. 8055, 2018
This Bylaw that updates the 5-Year financial Plan to reflect some shifts in Capital project spending was adopted by Council.

Official Community Plan Amendment Bylaw No. 8042, 2018 to Return Heritage Conservation Area and Related Protection to 207/209 St. Patrick Street
This Bylaw that returns HCA protection to this house in Queens Park upon the request of the homeowner was adopted by Council.

Bylaw Notice Enforcement Bylaw Amendment Bylaw No. 8049, 2018
This Bylaw that sets fines for violations of our Business License Bylaw related to cannabis retailing was adopted by Council.

Road Closure and Dedication Removal (Clarkson Street) Bylaw No. 7950, 2017
This Bylaw that closes a thin sliver of Clarkson Street to support the encapsulation of the SkyTrain line and the adjacent development was adopted by Council.

Official Community Plan Amendment (Electric Vehicle Infrastructure Guidance for Development Permit Area Guidelines) Bylaw No. 8039, 2018; and Zoning Amendment Bylaw (Electric Vehicle Charging Infrastructure in Residential Buildings) No. 8040, 2018
These Bylaws that make it a requirement to pre-wire new residential buildings for EV changing were adopted by Council.

Zoning Amendment (420 Boyne Street) Bylaw No. 8036, 2018
Finally, this Bylaw that approves the zoning for the new Animal Shelter facility in Queensborough was adopted by Council.

And that may or may not be my last council report! It’s been fun!