The 2016 Census data is starting to trickle out. I’m not sure if it is for dramatic effect, or if different data sets require different massaging levels, but the info you and I provided Stats Can in 2016 will be released in several stages through 2017. The first tranche, released this week, is population and residential dwelling count per census tract, along with numbers that can be calculated from those, like population change since 2011, population density, and residential vacancy rate.
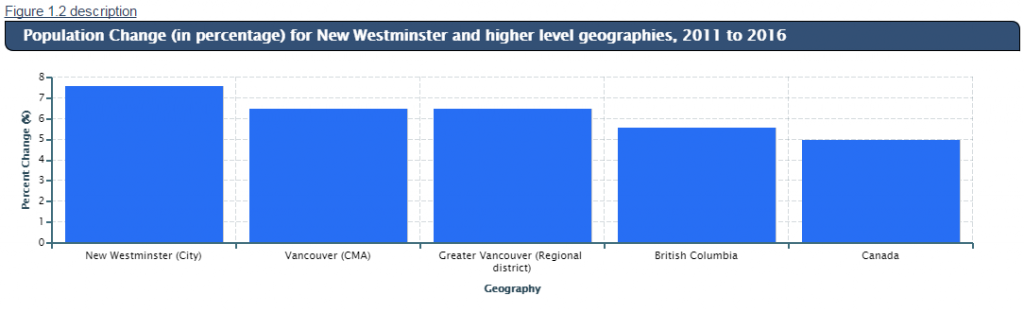
It should be no surprise to anyone that New Westminster is growing. Just a little under 71,000 people called New Westminster home in 2016. In terms of population growth, New Westminster grew about 7.6% over those 5 years (which works out to an average of about 1.2% increase per year). This rate of growth is above the average for Vancouver (6.4%), BC (5.6%), and Canada (5%).
There is a website called CensusMapper where the raw census data is popped into a map of census tracts as it becomes available, providing quick analysis opportunities for data geeks (like me).
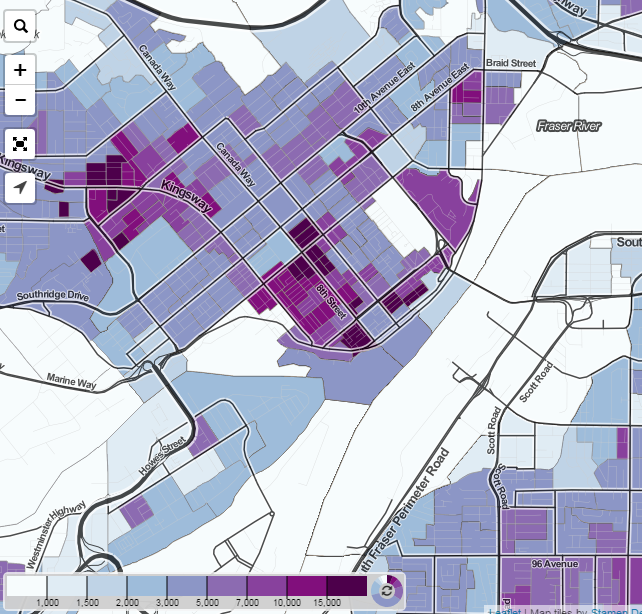
Density is a simple measure of the number of residents per square kilometre, and density is one area where New Westminster leads the nation (by some estimates, we are the 4th or 6th densest Municipality in Canada). This s a result of several factors, including us having a relatively small land base (only 11 square kilometres), 150+ years of being the centre of expanding hinterlands that created their own local governments, and our being largely built out as an urban community. It is no surprise that Downtown and the Brow are the densest parts of the City, Queens Park and the industrial areas the least dense:
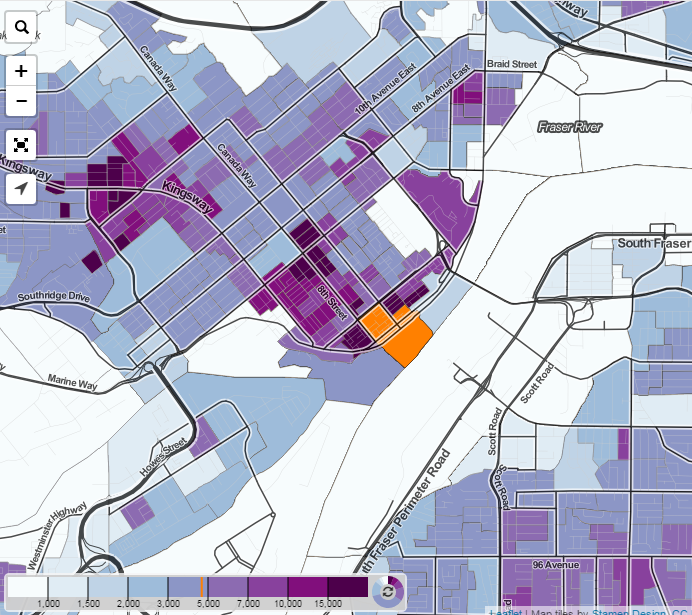
There are a few things off with this presentation, as the census tracts include areas like the river and park land, so the east half of Queens Park neighbourhood is shown as less dense than the west half, which does not necessarily reflect the true residential density differences on either side of Second Street. In the image below, I highlighted in orange a downtown tract that is biased by including the river – without the river, it may be darker purple like the adjacent tracts.
Finally, there are some interesting patterns in the Population Growth plot. It is clear (and not surprising) that growth is not evenly distributed throughout the City. We have been building a lot of family-friendly ground-oriented “missing middle” housing in Queensborough, and that has led to predictable growth. Areas where we have towers and other forms of multi-family dwelling are growing, with only very moderate growth in the West End and other single family neighbourhoods. The only surprise is that the Connaught Heights neighbourhood, during significant regional growth driving an ongoing housing crisis, somehow shrank in population.
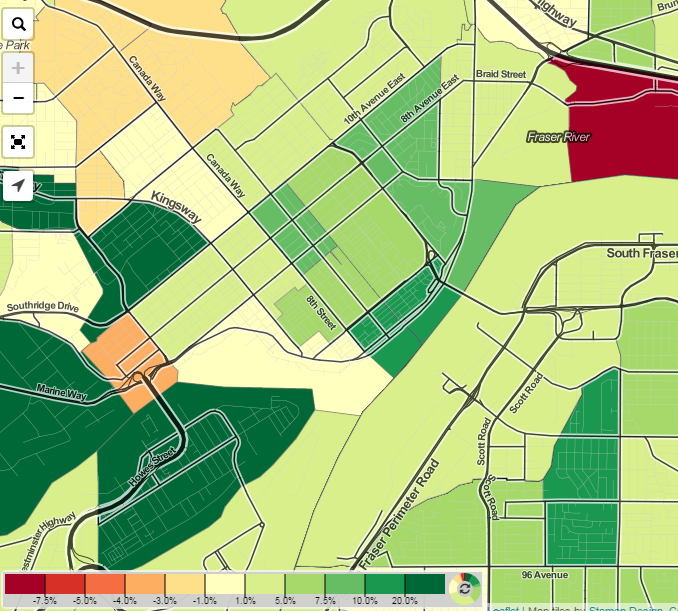
This is a concern. Both our City’s long-range planning and the regional planning documents depend on concentrating growth along rapid transit lines, for a variety of sustainability and livability reasons. We have slower growth around Braid and Sapperton Stations than in the relative transit desert of Queensborough, and actual population loss around 22nd Street Station. Keep this in mind as we discuss the OCP in the months ahead.
“We have slower growth around Braid and Sapperton Stations than in the relative transit desert of Queensborough, and actual population loss around 22nd Street Station. ” How is this anything other than a dismal failure in city planning? I have always been astonished by the fact that the city did not manage to encourage / approve a single high density development near 22nd St station in 30 years! Can we expect to see a shake-up in the city planning department soon? Clearly the people who are in charge now are not succeeding in implementing long term transit-centered densification plans.
That 22nd Station area hasn’t felt development pressure is enough of an enigma that our Mayor actually did a research paper on it back when he was a City Councillor and taking courses at the City Program at SFU. I don’t think Planning Staff are to blame, as they are the same planning staff who have overseen significant growth around 3 other SkyTrain stations, and who are working with the developers around master planning the Sapperton Green site. I have some theories, but maybe will put those off to another blog post.
Actually, when reading Major Cote’s thesis on the subject it becomes clear that he places the blame for the lack of development at 22nd Station squarely on poor land use planning. It is worth noting that New Westminster Station is the only area where planning staff appear to have focused their attention. If anyone considers the ‘growth’ around Braid and (to a lesser extent) Sapperton stations to be anything but dismal, I have a bridge to sell them. Both stations actually have a lower number of boardings than 22nd.