Ask Pat: “it(‘)s?” -UPDATED!

tom asks—

Is there a good reason why you often and erroneously put an apostrophe in the possessive form of “it?” (See e.g., “Photo radar has it’s use,” “This book (along with it’s Canadian version” and others too numerous to mention).
“It’s” is a contraction of “it is” and nothing else. Possessive pronouns don’t take apostrophes: we write “my,” “your,” “his,” “her,” “its,” “our,” “their,” “whose,” and so on. I’m only bringing this up because you’re a fine writer, which makes these occasional punctuation lapses even more jarring. It’s like seeing you smile with a piece of lettuce in your teeth.
Anyway, thanks for letting me sound off. I’m glad we have you on the city council, and I’ll keep on enjoying your articles — with or without the apostrophes.

Simple answer: Much like my penchant for ending sentences with prepositions, starting them with conjunctions, and generally letting them run on past any kind of social norm, I need an editor. I am pretty proud of my punctuation overall, but have a frenetic writing style, terrible typing skills, do most of my writing in me free time distressingly close to midnight, and hardly have the time to edit my own stuff, so bad practices slip through. Or maybe I just put them there to see if you are paying attention. Really, I just need an editor.

Thanks for reading.

Update:

…and to the three (3!) people who have already written me offering editing services for as little as a penny a word: No. You see, this little blogging hobby of mine returns me exactly zero dollars, and I am in no position to pay someone to facilitate my hobby. Oh, god, no! SEO and “Monetize your Blog” people, please don’t write me now, not interested, not doing it, can’t even imagine why I would.

You might want to look at this page (oh, boy, it really needs an update!) about why I am doing this. I started blogging for the fun of it, and because I had a lot to say about things in the City and about the state of the world. I now do it for somewhat different communications goals – I want people to understand a bit more about what City Council does and how I, as a newbie Councillor, am learning to understand the job. I also want to make it easier for people (especially those who disagree with me) to understand how I approach issues in the City, as I generally find the “traditional media” doesn’t have the time or inclination to dig past the he-said/she-said aspect of most stories. If things go well, it will probably turn into an X-year running journal of idealism slowly eroded by cynicism as my soul is systematically hollowed out by the sheer impossibility of representative governance. Or everything will be good. Who knows? Should be fun to see.

However, it will always be amateur-hour here at GreenNewWest NWimby PatrickJohnstone.ca because that is what people (and by “people”, I mean “me”) come here for, and because the world is full of really interesting professional writer types that you should be reading if you want quality professional writing skills with editors. Just today, a great new source of professionally-curated, well-written, excellently edited, and beautifully presented on-line and print media has entered the Hyper-local New Westminster scene. I’m really looking forward to where Tenth to the Fraser is going to take us!

Utilities 2016

As we are deep in to budget times at the City, I wrote a couple of previous posts comparing the amount of tax collected by New Westminster, and the rate of tax increases in New Westminster relative to the other Cities in the Lower Mainland.

If you are a homeowner in New West, you also paid your annual utility bill recently, and you may have noticed the rates for utilities are going up faster than your taxes. So it is worthwhile comparing between municipalities, as the way they manage their utilities has an impact on the taxes you pay, and the cost of living in your community.

First off, I removed the very rural municipalities from this analysis, mostly because the comparison of apples to apples is difficult. Anmore, for example, has no municipal sewer service, so every resident has their own septic field. Water services on Bowen Island are limited to parts of the community, and the level of service provided to Lions Bay and Belcarra is very different than in major communities.

Even within the “bigger” communities, there is variety. The Township of Langley provides about half of its water through its own groundwater wells, White Rock has its own groundwater supply for 100% of its needs, where pretty much everyone else who charges for water gets it from he GVRD. Large numbers of Langley residents and smaller numbers of Richmond, Pitt Meadows or Maple Ridge residents still use septic fields. Trash collection services vary widely across the region.

I have done my best to compare the cities based on the numbers they made available on their websites (as of March 1, 2016 – yes I wrote this pose a few weeks ago and just haven’t had a chance to put the graphics together). All the numbers shown are the published 2015 rates, except for two Cities that have already published their 2016 rates and purged their 2015 rates from their respective web sites, which I label in the diagrams below. So the numbers you see don’t reflect the numbers on your bill this year because I am comparing 2015 values, because that is the data available.

To start with Water Services, it is important to note that some municipalities meter their water, some charge a flat fee. If there is a flat fee available, I listed that. If only a metered rate is available, I calculated the amount they would pay if the household consumes the Lower Mainland average of 350 cubic metres of water per year.

water
Average household water bill per municipality. Flat Rate for Single Family Home or metered rate for 350 cubic metres.

As you can see, New Westminster is about the middle of the pack, and slightly less than the regional average of $519. Surrey is especially high as their flat rate is somewhat punitive to encourage voluntary metering, whereas West Van is fully metered and charges pretty high rates (all of those single family homes on large lots, high slopes, and hard rock result in significant infrastructure cost for their utility).

The sewer utility comparison tells another story. New Westminster is the second most expensive city in Greater Vancouver for sewer rates:

sewer
Sewer rates for Single Family Detached homes, including drainage rates if run as a separate utility. For metered municipalities, 350 cubic metres consumption was presumed.

This can be partially blamed on the age of our infrastructure (we need to put more into reserves sooner to plan replacement/upgrade) and a large amount on us still having a large proportion of our sewers not source-separated. We send a lot of storm water to the treatment plant, and that is really, really expensive way to deal with it. The alternate is to accelerate our source separation program, which also happens to be very, very, expensive. There is a whole blog post to be written on this point alone, so I’ll leave it be for now.

Finally, garbage and recycling programs vary probably the most between municipalities. As some Cities have bi-weekly trash collection, and vary greatly in the volume of different waste types they collect, I tried my best to compare to the “baseline” in New Westminster, which is 120L trash and green bins, unlimited recycling bins.

waste
Municipal solid waste / organics / recycling rates per household, assuming 120L bins where options exist.

As you can see, New West is slightly below the middle of the pack for solid waste services. This reflects two competing trends. Our city is compact, which should reduce the cost for trash collection, but we have one of the largest percentages of residents not living in the Single Family Detached, where trash is collected commercially and not by the City, which hurts our economy of scale somewhat.

Put these all together, and here is where all Municipalities compare on utility rates:

allute

We are the 5th most expensive Municipality out of 17, firmly in the top third, almost completely driven by our higher sewer rates. As there is a complex interplay between tax rates and utility rates, it is interesting to add our average residential tax per household number from this old post to the amount we pay in utilities, to show a closer approximation of real costs between Cities:

combo

Not surprisingly, West Vancouver with the highest taxes and the highest utility rates, is standing tall compared to all others. It is more interesting to see Surrey with its very low taxes jump up to the middle of the pack because of higher utility rates (driven in this analysis, by the punitive “non-metered” water rates, a Surrey resident can probably save $250 a year by getting a meter, which would put it down around Pitt Meadows overall). New Westminster, as expected, is somewhere down on the low side of average, 11th of 17 municipalities.

So what does this all mean? Not much, especially as this is a bit of a jumble of data – a combination of sources with great citations, but combined in a way that would get me laughed out of accounting school. Overall, though, it does suggest that New Westminster is not running its City anomalously less or more efficiently than any other city in the region. New Westminster does not have the costs or services of West Vancouver, but spends more than Langley City. Outside the few anomalies at the ends of the charts, it is probably not surprising that similar cost drivers overwhelm wildly varying political philosophies, and most Cities in the region have found a way to balance the needs and desires of their residents within very similar funding envelopes.

Community – the rest of March.

My plan to provide regular Smilin’-Politician-in-the-Community blog posts keeps getting derailed. But let’s see if I can catch up since my last report about two weeks ago, because I have been smiling quite a bit.

We had a meeting of the Mayor’s Public Engagement Taskforce, which has been doing some pretty cool work as of late in figuring out how the City can do a better job engaging with the public (expect to see some reporting coming out this spring). I also had an ACTBiPed meeting, and have been doing some work with the Mayor’s Canada Games Pool Taskforce.

I attended the UNIBUG Forum. The User Network for Insect Biology in the Urban Garden (UNIBUG) is a citizen science initiative at Douglas College that lets people doing urban gardening contribute to research into beneficial insects, while providing a learning network to help them garden better. If you have a garden box, a backyard gardens, or even planter gardens in New West, you should check out UNIBUG and see if understanding your bugs is right for you!

I attended two artist talks at the New Media Gallery, both relating to the recently-closed exhibit OTIC. Jesper Norda spoke about his piece The Centre of Silence, and showed us some of his remarkable earlier works. Then on the closing day of OTIC, composer John Oliver walked a group of us through the exhibition, bringing his interpretations of the works, drawing from his vast experience in composition, avant-garde music and psychoacoustics.

ud2

It was interesting to me, as someone who thinks pretty squarely about topics of science (when they talk about the mass of the air in the room, I can’t help but do a Fermi Estimate: “22 Litres per mol, 30grams per mol, so ~700 grams per cubic metre… etc.”) to be given a completely different viewpoint that connects the actual science to how we interpret sound. It was educational and brought a whole bunch more out of the exhibition I already really enjoyed.

I also wanted to note, after leaving the Norda talk on a Thursday night (I had to rush off to curling), I was riding my bike up Columbia Street and was amazed by the entertainment opportunities. There was an Open Mic going on at Old Crow Coffee, live music at el Santo, live music (and a new menu!) at the Heritage Grill, and a general buzz of activity downtown. I can’t help but feel we are turning a corner here…

Talking about turning corners, the group that tried to put together an electric racing cart series a couple of years ago are back on the scene, and it appears that a series is happening this summer. A few of us were given an opportunity to check the carts out in the City Hall parking lot, with a pro driver going fast around an impromptu circuit, and several of us going quite a bit slower:ud3

The carts are your typical high-performance racing carts, except that they are 100% electric powered, which makes them scary quiet, and scary fast. apparently we have a race coming this July in Downtown New Westminster. Hold on to your hats.

What kind of a Metro Area do we live in that a former transportation commissioner of New York can sell out a talk in a 700+ seat theatre and be given rock star status while here? There was a serious urban planning and sustainable transportation geek-out at the Vancouver Playhouse when Janette Sadik-Khan arrived on the Vancouver stop of her book tour. And I, of course, was the total fan-boy:ud1Her book “Streetfight: Handbook for an Urban Revolution” tells how she re-drew the streetscape of New York City following a motto that “The public realm is the public’s realm”. From strategically reclaiming poorly utilized parking spaces to closing a stretch of Broadway to make Times Square a human space again, he book is a manual of how to take out streets back from those who want to use them only as roads.

It is also full of condensed insight, beautifully concise explanations clearly honed by years of having the same arguments discussions about the same controversial simple ideas to make public space more useful and pedestrian spaces safer. Her page-and-a-half about curb extensions should be required reading for anyone who argues that removing them from Royal Ave will help anything.

So that, a trip over to Saturna to make life difficult for some scotch broom, and the wrap-up of the curling season (Team DeGobbi finished in the semi-finals! Congrats to Team Pierce for winning the Royal City Curling Club’s 50th Club Championships!), have been keeping me busy and smiling.ud4.

Ask Pat: Safety Dictator

Nicole asks—

Since your wonderful idea of a 30 km/h urban speed limit has drawn some ire, what other controversial things might you do to make our roads safer if you were made Dictator of BC for, say, a year? (I am guessing that photo radar is very high on the list, if not number one.)

Ire!? If an idea doesn’t draw ire from some sector, it is probably not worth even discussing. You may have heard some ire, I heard a lot of people saying its about time. Just this week, there were articles in Price Tags (Vancouver’s best Urbanism portal), there have been great results out of Toronto on their speed reduction program, and Seattle has joined the fray. I even took this photo at the Janette Sadik-Khan talk in Vancouver on Tuesday night:JSK20

Ire be damned, I want our streets to be safer. As JSK herself says: “When you challenge the status quo, it pushes back. Hard.”

I like the tone of your question, however. What would I do if I was Dictator for a year and was able to do whatever I wanted to make roads safer? Not sure I could get it all done in a year, but Dictators have armies to do their bidding, right?

Photo radar has it’s use. The Pattullo Bridge is a perfect example of a 50km/h road where everyone goes 80km/h and the resultant accidents are incredibly dangerous for other bridge users. It also reduces the inferred safety of the bridge, and is used as a primary reason for replacement. With careful application and an emphasis on safety (as opposed to punitive punishment in places where poor road design encourages speeding), photo radar has a role.

Look at this stupid road. Nothing here tells you to go 60km/h, except the sign. Of course everyone goes 80
Look at this stupid road. Nothing here, not the >3.5m lanes, not the generous shoulder and fixed divider, not the wide-open sight lines, nothing tells you to go 60km/h, except the sign. Of course everyone goes 80 or faster. A silly and punitive place to put Photo Radar, but dollars to donuts, the first place it would be installed.

I also think intersection cameras have a role. There are some in New West, and ICBC and the Integrated Road Safety Unit have a program to support them. However, they seem to concentrate on the red-light runners, likely because it is the easiest thing to enforce with a camera. I’m just as concerned about illegal turns, failing to yield to pedestrians, and entering intersections you have no possible way of exiting in order to “beat a light cycle”. With all the talk of distracted pedestrians and dark clothing, it is a pretty important point that the majority of pedestrian fatalities are caused by the driver failing to yield right of way in an intersection.

To make roads safer for cyclists, I would start by implementing (almost all) the recommendations that the Ontario Coroner released a couple of years ago after investigating cycling deaths in the province. I wrote a long piece on this once, but in summary: build safe infrastructure for cyclists, improve education for school students and all drivers, pass a 3-foot rule, and so on. We already have a pretty good idea what works, this isn’t radical or anything surprising. All that is lacking is the politcial will to make it happen.

The next big step would be nothing less than a complete re-writing of the design standards for urban streets. This is major part of Janette Sadik-Khan’s thesis for road safety. The existing standards for road design, paint markings, signs, and other treatments are from a different era, and were developed with the desire to make driving through our cities as efficient as possible, with only a nod to driver safety. That the “efficient movement” of cars makes the environment for all other road users less safe does not seem to be addressed.

JSK points out the American road design bible (“Manual on Uniform Traffic Control Devices”) has more than 800 pages of diagrams and plans describing the standards, 800 pages in which not a single pedestrian is shown. This book (along with it’s Canadian version) needs to be thrown away.

The good news is that there is already a lot of work being done on a better book to replace it. The National Association of City Transportation Officials has a go-to book called “The Urban Street Design Guide” That needs to become the standard, not the alternative. We can no longer use a 1950s guide book to adapt our 1920s streets for 2015 users. Time to challenge the status quo.

This probably exceeds the authority of the Dictator, but I would also change the laws to make cars safer. This engineering work is being done primarily in Europe, and some of it is becoming mainstream, but we can and should make more changes sooner. This includes a suite of things: better crush zones in front bumpers; softer hood materials with larger energy-absorbing gaps between sheetmetal and hardpoints; use of active cushioning (airbags); injury-reducing body shape geometry; larger windows with smaller pillars to improve driver visibility; active and passive collision avoidance systems.

While we are at it, we can add regular vehicle inspection to assure these systems work, and have not been messed with. There is no place in the urban environment for the suite of modifications that make automobiles unsafe for the people sharing the environment: trucks lifted to ridiculous heights, bull and grill guards, black tinted windows and lights, etc. I know that this is a radical idea in a society where many people consider their car an extension of their personality, and anything that impacts the design of their car would be seen as squelching freedom of expression.

Talking about Freedom of Expression, I am a keen follower of the move to change the language of traffic crashes. Read your local newspaper about a pedestrian being killed by a driver, and the headline is usually some form of “Pedestrian killed by car”. The events are always referred to immediately as “accidents”, which makes them sound inevitable, something that just happens, and presumes there is no fault (and, by inference, nothing we can do about it).

We can change how we value public space and our expectation of pedestrian safety by simply changing our language. “Pedestrian hit by driver of car” makes it clear there are two people in the transaction, not a person and an inanimate object. “Collision” and “incident” are both better terms than “accident” until the police and ICBC have an opportunity to determine the cause of the collision (inattentive driving? texting while walking? bad street design? non-functional brakes?). I think words mean something, and the words we use frame the discussion we will have, and we need to have a better discussion, because people are getting killed and we should have no tolerance for it.

Boy, I really sounded like a Dictator there, eh?

Toll comment

I received this comment to my previous post about $1 tolls:

Another big problem, amongst others in this plan, is that it does not fairly distribute the burden on all Lower Mainland residents. I notice that nobody seems to think that the Burrard, Granville, Cambie, No. 2 Road, Dinsmore or either of the Moray Channel Bridges should be tolled. Therefore, if your objective is downtown Vancouver, all residents of Vancouver, Burnaby, Port Moody, New Westminster and Coquitlam are exempt from tolls. Ditto for any Richmond resident working at YVR. And yet, their cars place as much stress on the infrastructure and contribute to congestion/GHG emissions as a car coming from across the Fraser or Burrard Inlet.

There is a lot packed inside this succinct comment, and it deserves a fuller response that I can fit in a comment. If we decide to toll all/most bridges, which bridges do we toll?

The Mayor of Delta provided an analysis of tolling all crossings of the Fraser River and Burrard Inlet within the general TransLink area. I pointed out a problem with including the Laing bridge, as it is Federal, and YVR isn’t going to want someone else collecting tolls on their infrastructure that they built for their customers to use.

There are also (as noted in the comment) three more crossings of the middle arm of the Fraser (the No 2 Road, Dinsmore and Moray bridges) that all belong to the City of Richmond. There are also three bridges crossing False Creek (the Burrard, Granville and Cambie) that belong to the City of Vancouver. Should we expect those two cities to turn the infrastructure that they paid to build and still pay to maintain, over to regional tolling?

Should we expect their respective Mayors to take any different an opinion about this than the Mayors of the North Shore do when it is suggested their residents and businesses start paying tolls without a concomitant return in infrastructure investment for their residents and businesses?

Perhaps we are asking this question the wrong way. Instead of asking where we can toll, we should be asking what we want to achieve with a regional tolling strategy.

Although many appeal to “fairness”, that discussion usually devolves to getting someone else to pay more and the commenter to pay less. There is little fair in transportation funding. Pedestrians and cyclists subsidize drivers, transit users pay to cross rivers, drivers don’t. We all pay for TransLink whether we use buses ourselves or not. People in Vancouver are paying to build transit infrastructure in Prince George, but Prince George residents are not expected to pay for TransLink infrastructure, BC Ferries that run on tidewater are expensive, those that run on fresh water are free. It isn’t fair. Let’s put fair aside.

One thing we may try to do is manage the infrastructure we have more efficiently. The toll on the Port Mann has caused a decline in the use of that brand new and woefully underutilized crossing, and an offsetting increase in use of the aged, decrepit and congested Pattullo. When (if?) the Massey and the Pattullo are replaced with tolled crossings, the Alex Fraser is going to be a gong show. The idea of balancing tolls across the region is one way to address this issue.

Of course, flat tolls on all bridges is a pretty inelegant and inefficient way to do this. Dynamic tolling where off-peak crossing costs are lower than peak times, and even (gasp!) temporary reductions on some alternates when an incident or construction is causing one crossing to be jammed, are possibilities that could make our existing infrastructure carry loads better, and make road use more predictable. Of course, this is effectively the same thing as increasing capacity, and induced demand will result in the same net congestion within a few years anyway. Which brings us to the third (and best) reason to toll crossings.

Transportation Demand Management (TDM) is the only thing (emphasis needed here: *The. Only.Thing.*) that has ever been effective at reducing traffic congestion in urban areas. When we talk of “road pricing” or “congestion pricing”, we really mean using the forces of the market to adjust traveller’s behaviour. Airlines do it (it costs more to fly on Friday and at Christmas), Ski Hills do it (it costs more to take a lift on a Saturday in December than a Tuesday in March), Ships, Trains, Busses, Car Rental companies, hotels – they all do it. Charge more at peak times and less in slow times to encourage some percentage of riders to take the off-peak trip and save your need to build more capacity.

Except when we talk about an integrated regional transportation system, we can also incentivise different uses altogether. And herein lies some of the answer of which bridges we should toll.

If your objective is downtown” is a compelling part of the comment. Translink constantly reminds us, the living in the burbs – working downtown model does not apply to Greater Vancouver (reason #437 why the PMH! Project was a silly approach). Look at this compelling diagram from BTAworks  that shows where commuters travel. Most people from Surrey don’t commute to Vancouver, nor do most people in most communities.

JtW2011
Source: http://www.btaworks.com/wp-content/uploads/2014/07/JtW2011.jpg

However, there is no doubt the region has “zones” for the most part defined by water bodies, and just like we use those zones to determine transit use, we can use them to determine tolling policy.

The model suggested by the Mayor of Delta would divide the lower mainland into the following zones: the Mainland, South of the Fraser, Lulu Island, the North Shore and the North Valley.
map1

Although I admire the simplicity, this does seem to create significant inconsistencies, and as the commentor noted, if I want to drive the 45km from Anmore to UBC, I pay no toll, while I would pay two tolls to go the 12km from New West to my favourite Indian Restaurant in North Delta (and this is, like most things, all about me).

This also creates as bit of a strange zone-in-the-middle out of Lulu island, which I suspect would be of concern to the City of Richmond. Or not. Their residents may hate the idea that every time they wish to go somewhere more than 3m above sea level (and bring their car along) they need to pay a toll. Alternately, they may like the idea that toll-in and toll-out will reduce through traffic and make their City streets work better for the residents that live there. I frankly don’t understand the politics of Richmond enough to predict where that discussion would go, but I would wager less tolls would be favoured.

A perhaps more logical model I once saw suggested was to consider the Burrard Peninsula as the “central zone”, and create three other zones: South of the Fraser, the Northeast, and the North Shore:map2

This creates the slightly complicated (but not insurmountable) challenge of tolling crossings of North Road (or some imaginary line that runs roughly parallel to it). This arguably distributes the burden better. The problem is what to do with Lulu Island. Does it belong North or South of the Fraser?

The answer in that probably lies in one of the fundamental assumptions of using road pricing as a TDM measure: You need to provide alternatives. Simply tolling a crossing where people have no choice but to drive will do little to disincentivize people from adding to the traffic, but will do much to anger people who used to get a crossing for “free”. Looking at Lulu Island, the transit options to the south through the tunnel and Alex Fraser are not great. However, the Knight, Oak, and Laird currently parallel one of the nicest, shiniest, newest transit lines to ever grace the Lower Mainland. The pedestrian and bike alternatives are also there. So from a TDM perspective, it makes sense to toll the four north arm crossings, not the two main arm crossings.

map3

I agree, true distance-based road pricing is a better solution, but we are a decade or more from that being implemented, and we need to deal with a funding situation that is killing the regional transportation vision right now. Meanwhile we are bringing a bunch of new asphalt infrastructure into the equation within the next decade. I see a more regional tolling introduction as a good stop-gap measure, and we can no longer allow the perfect to be the enemy of the good. We need to get moving.

And yeah, $1 still isn’t enough.

Ask Pat: Tipperary U-turns

Chad asks—

I’m a Brow of the Hill resident who walks home from the Skytrain at Columbia St up 4th St every day. I’m wondering about the deal with Royal Ave and 4th St. Every day I see dozens of cars getting around the no right turn restriction on to Royal Ave by driving into the Tipperary Park parking lot and doing a u-turn. (Where I frequently feel I’m at risk of being run over). I’m especially concerned about this as the days get warmer and longer and more people will be making use of that great park, while those using New West as their highway between home and work zip around in the parking lot to try to bypass part of the Royal Ave traffic parade. I can see that there is a no u-turn sign in the parking lot but no one’s paying attention to it – makes me wonder why they even bother obeying the no right turn sign…anyway, would love to see this area made safer for pedestrians and park goers alike, and would greatly appreciate your thoughts on this!

It has taken me more than a month to answer this question, mostly because I don’t have an answer.

It isn’t only the “no right turn from 4th to Royal” folks who do this. It is also the “no left turn from 3rd to Royal” who turn right instead, go the block and pull a u-turn. Mix these with the people who drive through the City Hall parking lot and access 4th from there instead of waiting a light cycle on 6th

It is a mess. We have (according to some counts, although the source of this oft-cited number is somewhat obscured by urban legend) 400,000 vehicles a day passing through New Westminster, and for an hour or two a day, the legal accesses to the Pattullo Bridge are constricted, and those through-commuters do whatever they can to take a few minutes off their commutes. Except pay a toll on the Port Mann, of course.

It has been measured, this increase in 20,000 vehicles a day crossing the Pattullo (about 30%) since the tolls were applied at the Port Mann. There is a coincident 20,000-vehicle drop in daily crossings of the Port Mann. This is a huge part of the reason why this City has been working so hard to assure that any replacement for the Pattullo Bridge will result in a tolled crossing – to level that playing field. We are also lobbying to assure the bridge is not higher-capacity, as induced demand will assuredly result in congestion on the feeder routes increasing as capacity does. Finally, we worked to encourage people to vote YES for the funding of the Mayor’s Plan to bring better transit service South of the Fraser so those 10,000 extra people had viable alternatives to sitting in traffic in New Westminster and getting frustrated enough to pull a u-turn in a parking lot to shave a few minutes off their trip.

We can target enforcement in places like you mention, and the NWPD does have a traffic division who do this. Their priorities are not necessarily to catch “rat runners”, but to target the most dangerous road users at the most dangerous intersections. With a few thousand intersections in the City and a million road signs, they can’t be everywhere enforcing everything (and enforcement costs money!), but they are doing what they can against the tide.

So no easy answers, and yes I share your concern, but I don’t know the solution. I’d love to hear if you have any ideas to make the situation safer.

$1 Tolls: still not enough

I’m going to avoid being critical of Mayor Jackson, because I think her accepting the idea of road pricing as a Transportation Demand Management method (even in this watered down and ineffective format) is a sign of progress regionally.

I am going to be critical of the regional media for their lack of analysis in reporting this story. It is almost as if the story wasn’t “reported” at all, but instead the press release was repeated, sometimes with a few clauses moved around, with the most minimal amount of background (“the tunnel needs replacing!”) and no actual analysis. I cannot find a single report where a member of the esteemed press even checked the math.

Here is the math the Mayor provided in her press release:

That argument in the Mayor’s release was that $1 tolls would raise close to $300 Million (not the “$348 Million” reported by one local print media source) to pay for the local government portion of the Mayor’s Plan. Aside from a few of the questionable statements in that release (an increase of 20,000 cars a day does not suggest people are “avoiding” the Pattullo Bridge), you would think reporters would check the base premise. Is spending an hour with Google and a spreadsheet really too much to ask before the story is filed?

Lucky, I had an hour in the evening to sit down and compare this report to my earlier analysis that did get a little notice a couple of years ago, the last time this idea came up. So here’s the kind of analysis I would want to read in the media, if I felt it was doing its job.

The screenline numbers from 2011 used by Delta for traffic count simply do not reflect the reality of bridge use in 2015. I was able to throw this table together based on a bit of Google searching, and note every number is a hyperlink that connects you with the actual official traffic count source of data (for the crossings where such a thing exists).

Delta data: 2015 January 2015 September 2014 Annual
“2011” MAWD MADT MAWD MADT AADT
Laing 79000 79000 79000 79000 79000 79000
Oak 88000 69166 65069 75043 71779 67376
Knight 96000 96000 96000 96000 96000 96000
GMT 89000 77306 71633 87037 82531 79105
Qboro 88000 79724 73739 87113 82706 80108
Fraser 117000 113496 103281 121079 113984 107785
Pattullo 68000 72985 78043 83598 79633 68000
Port Mann 112000 96098 87905 106378 100608 94986
Pitt 79000 79000 79000 79000 79000 79000
GEB 30000 34520 34520 34520 34520 32054
Lions Gate 63000 58857 56918 63137 61357 60757
IWMSNC 127000 120600 112697 129971 125220 117854
Total daily crosings: 1,036,000 976,752 937,805 1,041,876 1,006,338 962,025
x 365 days: 378 357 342 380 367 351

The Golden Ears Bridge data is less certain, as it comes from TransLink financial documents, and is not collected with the rigour of the Ministry of Transportation data. The Pattullo data is horribly complicated in its reporting, but available as a daily number, not as an annual average. For the Knight, the Laing, and the Pitt River, I could find no useful data. Anything I found lacked a link to who collected the data, and was too old to be reliable. For those bridges, I projected the TransLink screenline data that the Mayor of Delta used.

How much traffic you count depends on when you count it (no surprise!). The biggest number (378 Million crossings annually) is a made-up number that projected the annual weekday traffic (AWD = average week day) over the entire week. As weekend traffic is generally 20-25% lower than weekday, that automatically gives you an inflated number, so for the purposes of projecting toll revenue, you are better to use ADT – average daily traffic. It also depends if you pick a winter, summer or fall day (with fall being the busiest urban travel season). That is why I listed both January and September data for 2015.

The last year for which the MoTI provides Annual Average Daily Traffic data is 2014. This number best balances out weekdays, holidays, seasons, and other shifts. It is important to note that every bridge with good traffic count data from MOTI has a significantly lower amount of traffic than the 2011 data used by Delta to make their case. I’m amazed that this point was not noticed by any media).

Regardless, using the concise MOTI data as the best regional and pan-seasonal effort where available, and the likely inflated Delta/TransLink numbers where it isn’t, the actual number is somewhere less than 1 million trips per day, and less than $350 Million with perfect across-the-board $1 tolling.

That hefty chunk of change looks good if it ignores the issue of what to do with the existing tolls on the Port Mann and Golden Ears. If they are reduced to $1 and included in this analysis, then we have to account for the $164 Million (2014 estimate) collected from those bridges in the current regime. This problem is exacerbated by the fact that neither bridge is collecting enough toll revenue right now to cover their financing costs, and the concessionaires want to keep getting paid.

There would be many things nibbling away at the remaining $186 Million, including the cost of setting up the tolling system and the cost of administering the tolls. Based on the TREO model, and their most recent Financial Reporting, they spend about $16Million collecting $120Million, so we will be conservative and call that 12% overhead not including the capital cost of setting up the system. Giving a generous benefit of doubt, I’m going to assume they can collect a $1 toll three times more efficiently than a $3 toll, but still getting us down to about $160Million.

There will also need to be some discussion with the owners of several bridges, as the Pattullo (see below) and Knight belong to TransLink, and the Laing belongs to the Federal Government through the Airport Authority. With all due respect to the Airport’s sense of charity, they are not likely to let someone else collect revenue from their customers on a piece of their infrastructure without some form of compensation.

And finally, it raises the uncomfortable question of how much of this revenue goes towards replacement of the Pattullo Bridge and Massey Tunnel. The Pattullo is part of the Mayor’s Plan, and was slated to be funded by a toll that is similar to the one on the Port Mann. With that idea now replaced by regional $1 tolls, the revenue required to cover the financing for that >$1 Billion project will need to be drawn from an ever-dwindling revenue stream.

The proposed $3.5Billion replacement for the Massey Tunnel, a project the Mayor of Delta is almost single-handedly in support of, would surely eat up more than the remaining revenue from the regional $1 toll. It is not part of the Mayor’s Plan, and it is hard to see the Mayors of the region agreeing to divert all of the regional tolling revenue to that one project when it does nothing to address the rapid transit and bus service improvements the region desperately needs. Not to mention any improvements to the North Shore…

So $1 a crossing is far from a panacea, but this discussion may lead us in the right direction. Tolling many crossings and sharing the revenue as part of a truly integrated regional transportation infrastructure investment plan (which is what the Mayor’s Plan is) is not in itself a bad idea. Once the infrastructure is in place, then time-of-day tolling shifts and other TDM measures can be put in to better manage demand, and even take away the imagined “need” for 10 more lanes of car traffic crossing the Fraser River.

Council Report – March 14, 2016

In my ever-strained effort to get a Council Report done before the subsequent council meeting, I am feeling pretty good about not having to use my entire two week break to get this one out.

Our Regular Meeting started with a presentation on the 2016-2020 Financial Plan. The draft plan looks at a 2.73% tax increase. We also had our official Opportunity for Public Comment on the budget.

Our accounting is complicated and regulated, and although it is completely transparent, it is not easy for most people to look at or understand. I have put together a couple of blog posts talking about how we compare to other Cities in how we collect and spend money, because I think that is a useful comparison. As much as we are “competing” with anyone in running a local government, I guess it is other local governments. However, that is not the whole story.

I am NOT an accountant, so I need to rely on our staff and our auditors to assure me that our budgeting is in compliance with PSAB standards, and our reporting to the Province meets the regulatory requirements. However, I am going to try in the next few weeks to put a few more blog posts together regarding the Financial plan, in hopes of making things more understandable about where your money is going.

Economic Health Care Cluster Branding,
One of the City’s economic development initiatives is leveraging growth that will come with the redevelopment of RCH, and aligning the Intelligent City Initiative and other local advantages to develop an Economic Health Care Cluster.

As is de rigueur for these types of economic development projects, the City needed to create a brand and identity to align our outreach and marketing efforts. I am not a branding expert, and frankly did not like the brand chosen when I first saw it, until it was explained to me and I was shown the application. Or maybe it was the beards.

If you don’t like it or understand it (see top banner), it is possible you are not the one being marketed to. This is not about selling the neighbourhood to the residents of the neighbourhood. It is about selling new businesses, not-for-profits, education and health care service providers, researchers and investors in the potential for a real economic interconnected science and innovation cluster. For that, I think it works.

New Zoning Bylaw: Initial Draft and Next Steps,
The City’s Zoning Bylaw is old (almost 75 years!) and unnecessarily complicated. This is because it has been edited almost constantly since it was first written, by different Councils, different staff, and for different reasons. New initiatives have been added to it at the whim of Council (like our Family Friendly Housing policy), edits to language made to solve immediate issues (like last year when we edited one land use provision to allow a Veterinary Clinic on 12th Street to add boarding for cats to their services), and old land uses that are no longer likely (broom manufacturing?) are mixed in with new land uses we would have never imagined when it was originally written (Vape Shops?).

For the last several years, Staff have been working on a new comprehensive re-write of the Bylaw. This is not about creating new rules or introducing new initiatives, it is about making what already exists internally consistent and easier to understand. The time is right for this, because we will be rolling out a new OCP (hopefully) by the end of the year, which will bring new policy and initiatives which will be much easier to introduce into a logically ordered and designed Bylaw than this old mess.

Update on Greenhouse Floor Space Ratio
Councillor Puchmayr raised a concern about the regulations around how large a greenhouse a person in the City can have. The issue with greenhouses larger than 100 square feet is that they invoke the building code (which is provincial), which increases the development cost of building greenhouses that size.

Bill M203 – Workers Compensation Amendment Act 2016
Council supported this bill to provide better support to first responders in how the Workers compensation Act addresses Post Traumatic Stress Disorder.

Strategic Initiatives
As part of our regular routine, Council is going to get an update report at the end of every month on progress of two or three of our Strategic Initiatives, so we know that progress is being made, we can ask any questions that might arise, and the public can be informed on what is going on.

This month’s update included the Front Street parkade upgrade, partial removal and Mews construction, which is coming along on time and budget. There have been a few concern raised by the local businesses, but for the most part things are moving smoothly as can be expected with an incredibly disruptive process. It is amazing to see the sun shining on the fronts of buildings along Front Street.

Also (perhaps) surprising is that traffic chaos has not occurred. There is a notable increase in “rat running” in the evenings especially, and increased enforcement to help manage that, but the large number of trucks that were expected by many to clog up Columbia and Royal have not appeared. We are doing vehicle counts, so staff will be able to report back to us on how the traffic fared with data, but in the meantime, the anecdotes support the Cheonggyecheon / Embarcadero / Harbour Drive model of traffic calming.

We also spoke about the Intelligent City Initiative, and progress on BridgeNet, where the City is putting dark fibre in the ground and securing deals with ISPs to lease that fibre to users in the City. The plan right now is to have something to sell by as early as this summer, and at that time to start hooking up more than 100 residential multi-family units and a few dozen strategic business locations to true 1Gbit internet service at process that should be competitive with what you are paying now to the Major Telecoms. More details to come here, watch this space!

The following items were moved on Consent by Council:

Roger’s Hometown Hockey Follow Up
I had a lot of fun at this event, and we cannot thank New West Minor Hockey enough for the help and energy they brought to the weekend. This did not cost the City much, thanks to volunteers, Rogers, and a generous list of corporate sponsors. The exposure of Queens Park and the Royals was good, lots of people got to meet Ron McLean and Cliff running and Kirk McLean, and fun was had by all. Also, a big thank you to our staff for making it appear to be a seamless operation!

1031 Sixth Avenue: Heritage Revitalization Agreement
This house in Moody Park is more than 100 years old, and presents a restoration challenge due to its level of deterioration and the housing needs of the land owner. Because of its age and potential heritage value, staff has been working closely with the homeowner to come up with a heritage preservation plan to accompany the building of a second home on the lot. We are pretty early in the process here, but signs are positive that an agreement can be reached.

Pattullo Bridge Replacement Project Revised MOU
With all the talk of the Massey Bridge and regional tolling, and following the failure of the Referendum that would have secured funding for the Pattullo replacement, we still have a bridge that needs to be dealt with. Negotiations between New Westminster, surrey and TransLink have been ongoing around the terms and details of the replacement plan. Through these negotiations, an MOU was developed that clarified for all three parties that the preferred [plan for the Pattullo is that which was laid out in the Mayor’s Vision for regional transportation: a 4-lane structure (that can be expanded to 6 lanes if all parties agree) with tolls to be build pretty much in the same location as the existing bridge.

There is much work to do yet, including finding the money, but at least we can start to plan around the agreed-upon terms. This does not mean the bridge upgrades happening this summer can be put aside. Even if everything fell perfectly into place today, the time needed for design, procurement, funding and environmental assessment means we wouldn’t likely see a shovel in the ground until 2018, and would not see a bridge put into service until 2022, so TransLink needs to eek a few more years of service out of the big orange arch.

Update on Anvil Centre 2016 Budget
We received an update report on the Anvil operations and budget. I don’t think anyone thought this major new facility was going to cost nothing to run, and the full revenue stream is not yet realized, but the costs are higher than I anticipated.

I’m cognizant that we need to look at the ROI on this operation – every time there is an event in the theatre, you cannot get a reservation at el Santo or the Hub, last summer during the Fan Fest we had literally thousands of people spilling out of the Anvil and using Columbia Street and the River Market spaces, supporting local businesses and raising the profile of Downtown New Westminster on the regional scale.

Ultimately, we will not realize the full value of this project until we lease the restaurant space, until the owners of the Office tower lease it out, and until the art programs reach a maturity that the location becomes the cultural hub that we expect it to become.

As I have said before, the measure of success for the anvil will happen in 10 years from now when it is a generator of community growth in the Arts in the same way the Canada Games Pool, Queens Park Arena, and Mercer Field (three facilities that also cost more for us to operate than they return in revenue) are generators of community growth in sports.

Special Occasion Permits – Salmonbellies
Our archaic and complex liquor laws require that we go through this process
every year so the Salmonbellies can sell beer at the League and Playoff games. Please watch lacrosse responsibly.

We then, as usual, wrapped the meeting by adopting a few Bylaws:

Housing Agreement (900 Carnarvon Street) Bylaw No. 7810, 2016
Given third reading last week, this agreement to make the 4th building at Plaza 88 a market rental building is now Adopted. It’s the law of the land.

HRA (235 Durham Street) Amendment Bylaw No. 7817, 2016
Given third reading last week, this agreement to extend the term for an HRA is now Adopted. It’s the law of the land.

Film Permit Bylaw No. 7793, 2016
Bylaw Notice Enforcement Amendment Bylaw No. 7814, 2016
Given third reading last week, these Bylaws regulate the Film industry in the City by codifying some existing policies and practices. Now adopted, it’s the law of the land. Please adjust your behavior accordingly.

Electrical Utility Amendment Bylaw No. 7816, 2016
The new electrical Rates bringing our rates in line with BC Hydro retail rates was given third reading last week, and is now Adopted.

And we are off for two weeks. Please enjoy other Monday Night programming.

Ask Pat: tax increases

RA asks—

This past year the assessed value of my property has increased by $150,000. Approximately a 30% increase. Using the property tax estimator, entering a rate increase of 0% results in an increase of my tax payment of 18% due to assessed value increase alone. Therefore this more than covers the 2.67% the city proposes. I understand that many homes faced similar increases this past year. For these reasons, I am not in favor of the tax increase proposed.

Can you tell me how the city has factored in the large assessed value increases into its budget and resulting proposed tax increase?

Wow. 30% in one year is crazy. It would be nice to think you made $150K this year just sleeping in your bed, but that doesn’t do you much good if you can’t sell – you have to put that bed somewhere. However, the short answer to your question is: it hasn’t. The longer answer is below.

Your assessed increase was significantly above the average increase in property values for the City over the last year, which was 11.7%. This means you are going to get dinged by the property tax system more than most. However, that doesn’t mean the City is getting extra money, it means someone out there in New West must have got an assessment increase less than the average, and they will see a relative tax savings this year.

The better way to answer your question is by going through a quick example of how the Assessment/Mil rate tax math works.

First off, the City has not yet settled on a tax increase this year. The current draft of the 5-Year Financial Plan that needs to be done by May (the “budget”) is built around a 2.73% increase. That is (more likely than not) the number that is going to come to council in the form of a Bylaw sometime in April. This means the City plans to collect about $1.8M more this year than we did last year in order to balance the budget. About $1.3M (1.97%) of that is “base budget” increases – inflationary increases that, if not approved, would result in a reduction in existing programs and services. The other approximately $0.5M (0.76%) is new departmental requests: things like additional staff to enforce and administer the Tree Bylaw.

Using the City’s handy tax estimate calculator, you can enter 2.73% and your assessed values from 2015 and 2016, and get an idea how much your taxes are likely to rise this year. For the fun demonstrative value of it, I entered several values for property assessment increases and City tax increases, and plotted out the results:

grahp

On the Y-axis (vertical) is the property value increase from BC Assessment. I don’t think many properties went down in value, and your 30% is the highest increase I have heard of, so this should cover most of the range of residents in the City. The average increase City-wide was 11.7%, which I show with the thick grey line. On the x-axis (horizontal) is the amount your tax bill will increase based on the three scenarios represented by the green line (City tax increase of 0%), the blue line (the City’s proposed 2.73% increase) and just for comparison, a 5% tax increase shown with a red line.

You can see that for the average assessment increase (11.7%) the tax increase is equal to the City’s set increase. As your assessment increase is an astounding 30%, your tax increase is going to go up much more than this, and the relationship is linear: if we raise taxes 0%, you will pay 18.3% more, raise taxes 2.73% and you will pay 21% more, raise them by 5% you would pay 23.3% more. My assessment went up about 17%, so my numbers would be 5.3%, 8.0% and 10.3% respectively.

However, 11.7% is the average increase for the City, so for every property that increased more than 11.7% there is one that increased less than 11.7%. For the owner of a property that went up 10% in value, the proposed tax increase is about 1% (less than inflation), and any property that increased by less than 8.7% in 2016 will see their taxes go down. I know you are sitting on a 30% increase and the regional real estate numbers are crazy, but by the virtue that your property went up almost 3x the average, there must be a large number of properties in the City whose increase was less than the average, and even below that 8.7% threshold.

To sum up, the big point here is that the City does not look at the assessed property value increases when calculating the tax increase required for the year. We look at our budget and determine what our need is to deliver the services required. This year it looks like about $1.8Million, so for every $100 we took in from property taxes last year, we need to take in (about) $102.73 to deliver those services and balance the budget. If the average property assessment was 1% above last year or 100% above last year, it does not change that 2.73%, and the only thing that increases or decreases your tax burden is the amount your property increased or decreased in value relative to the city-wide average.

If you think a 30% increase is not realistic, then you are able to appeal it. Too late now for 2016, but 2017 is just around the corner. The BC Assessment office doesn’t work for the City, so we have no say in how they do their work, but there is an appeal mechanism, and if you think your out-of-scale assessment is wrong, you can appeal. If you were to get your 30% increase appealed down to 20%, you will cut in half the amount of tax increase you experience. As a City, we have no skin in that game (because every one of your neighbours’ taxes will go up slightly to offset your reduction), but as homeowner whose assessed value went up 17% last year, I’ll be sharing your pain.

Council – March 7, 2016

The March 7, 2016 Council meeting began with the annual tradition of the May Day Draw. I’m not going to delve too deeply into this, but it was noted to me that this event was held the day before International Women’s Day, where we are asked to think about everyday examples of patriarchy in our lives.

The following items were moved on Consent by Council.

2015 Freedom of Information and Protection of Privacy Act Report
The City is subject to the Freedom of Information and Privacy Act. We get FOI requests on a pretty common basis, for a variety of reasons. This report lists the statistics for 2015. We had 72 requests for FOI documents, released 1,041 pages of paper documents and 3,170 pages of electronic documents. One request was forwarded to the Office of the Information and Privacy Commissioner (OIPC).

Status of Trans Mountain Pipeline Expansion Review Process
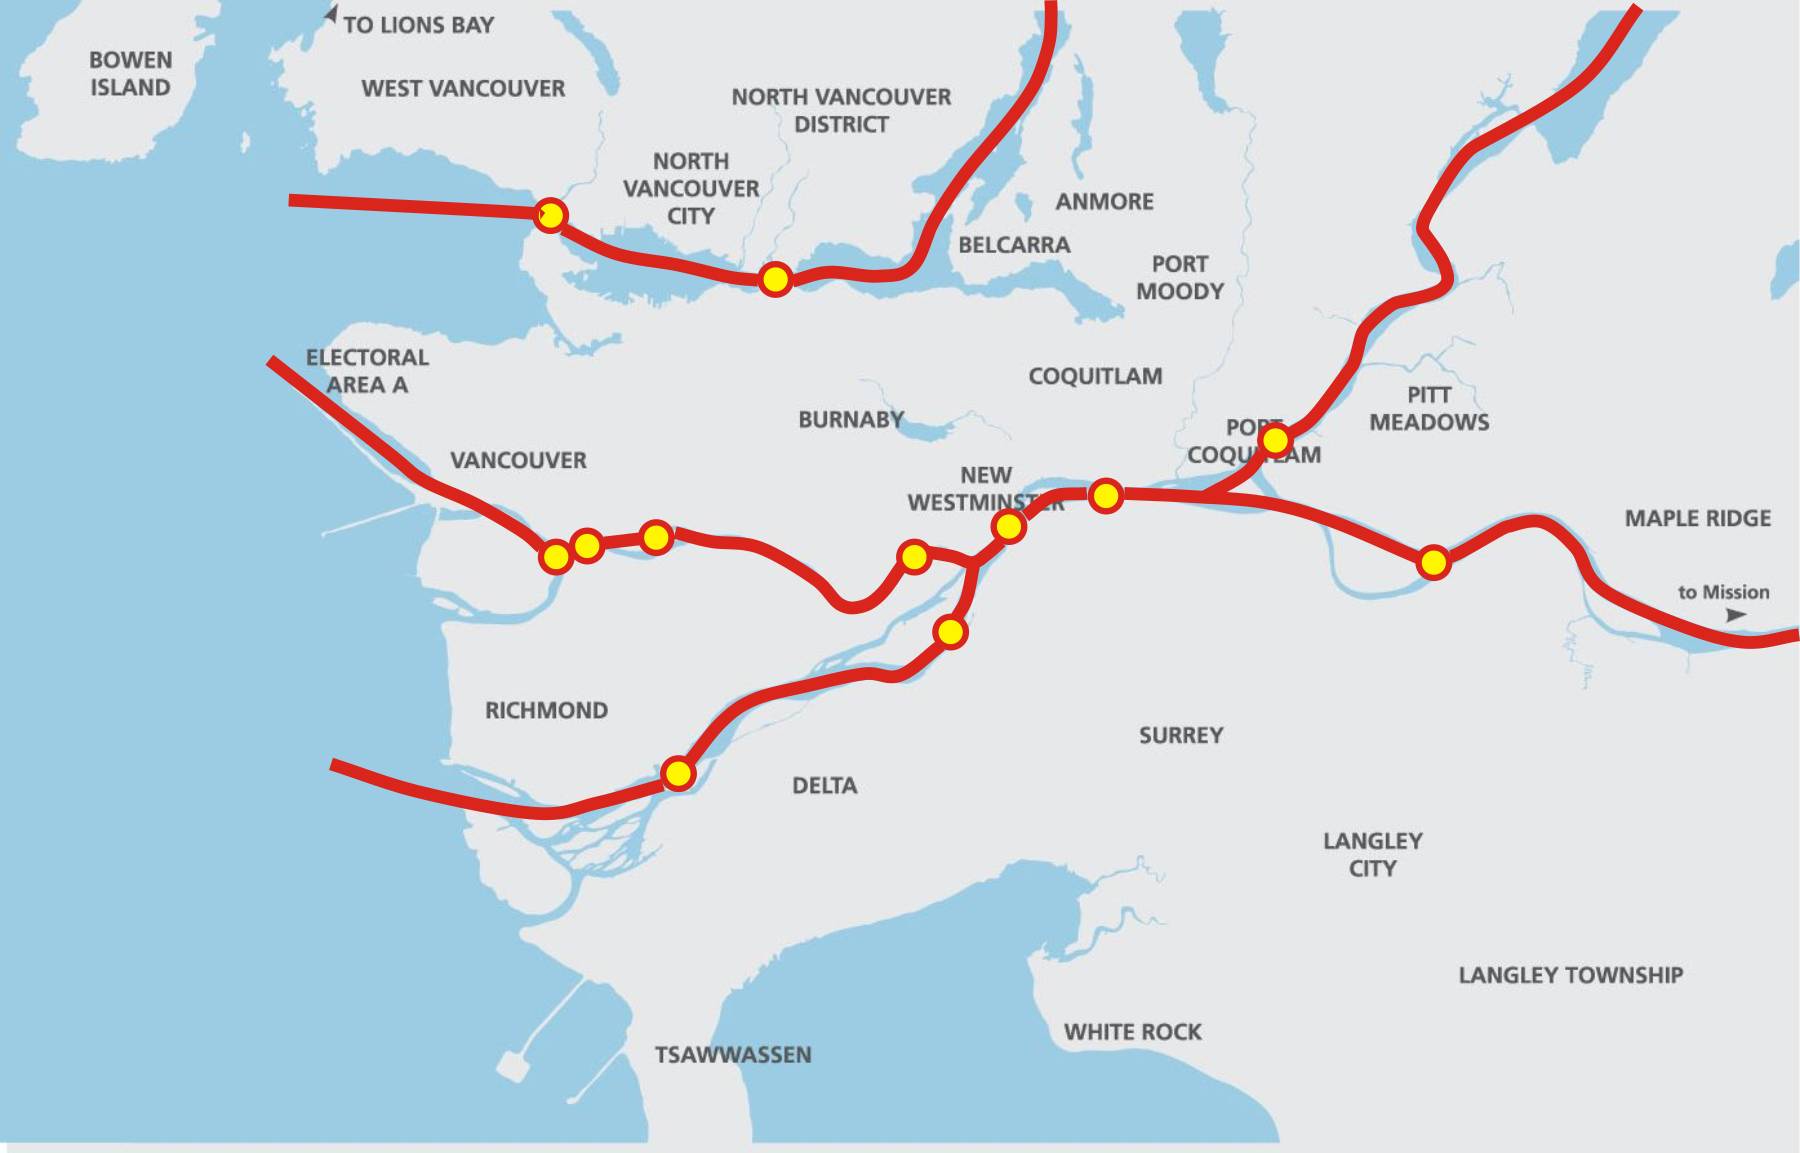
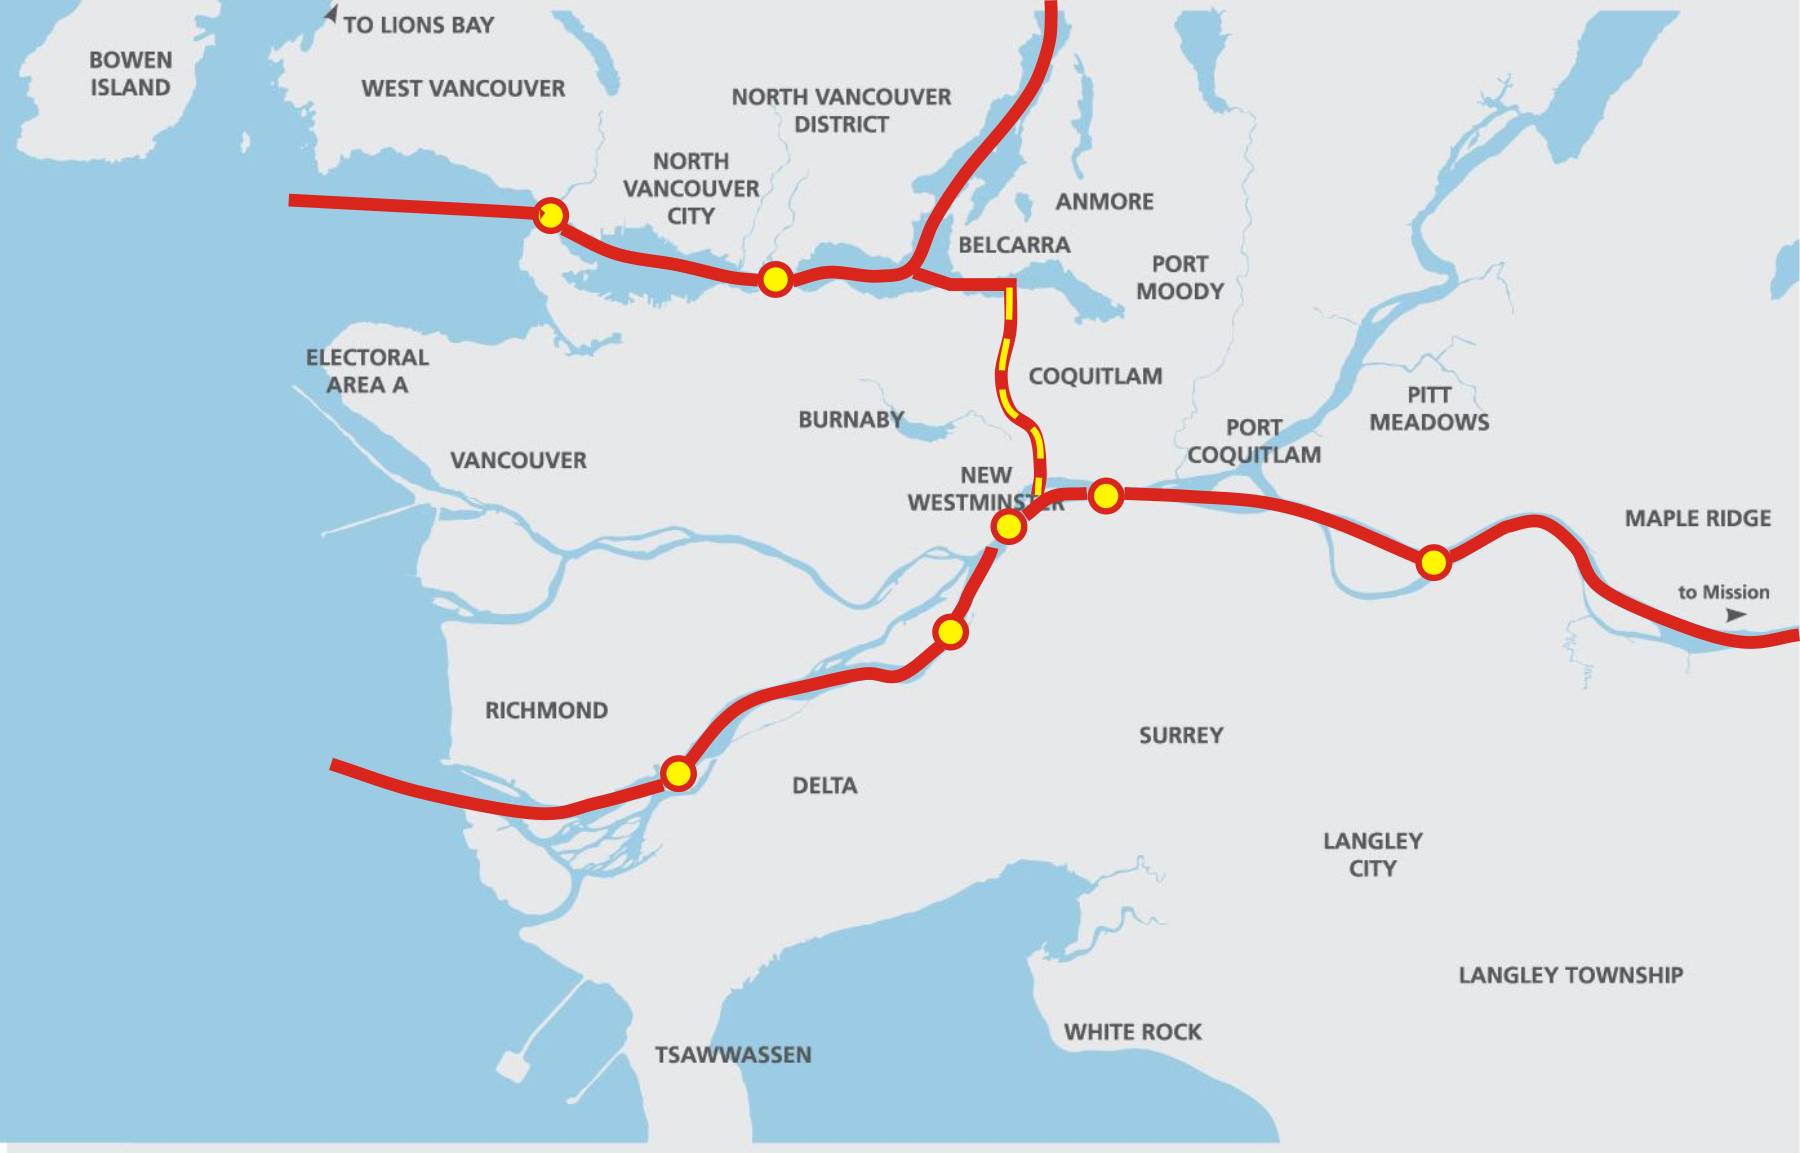
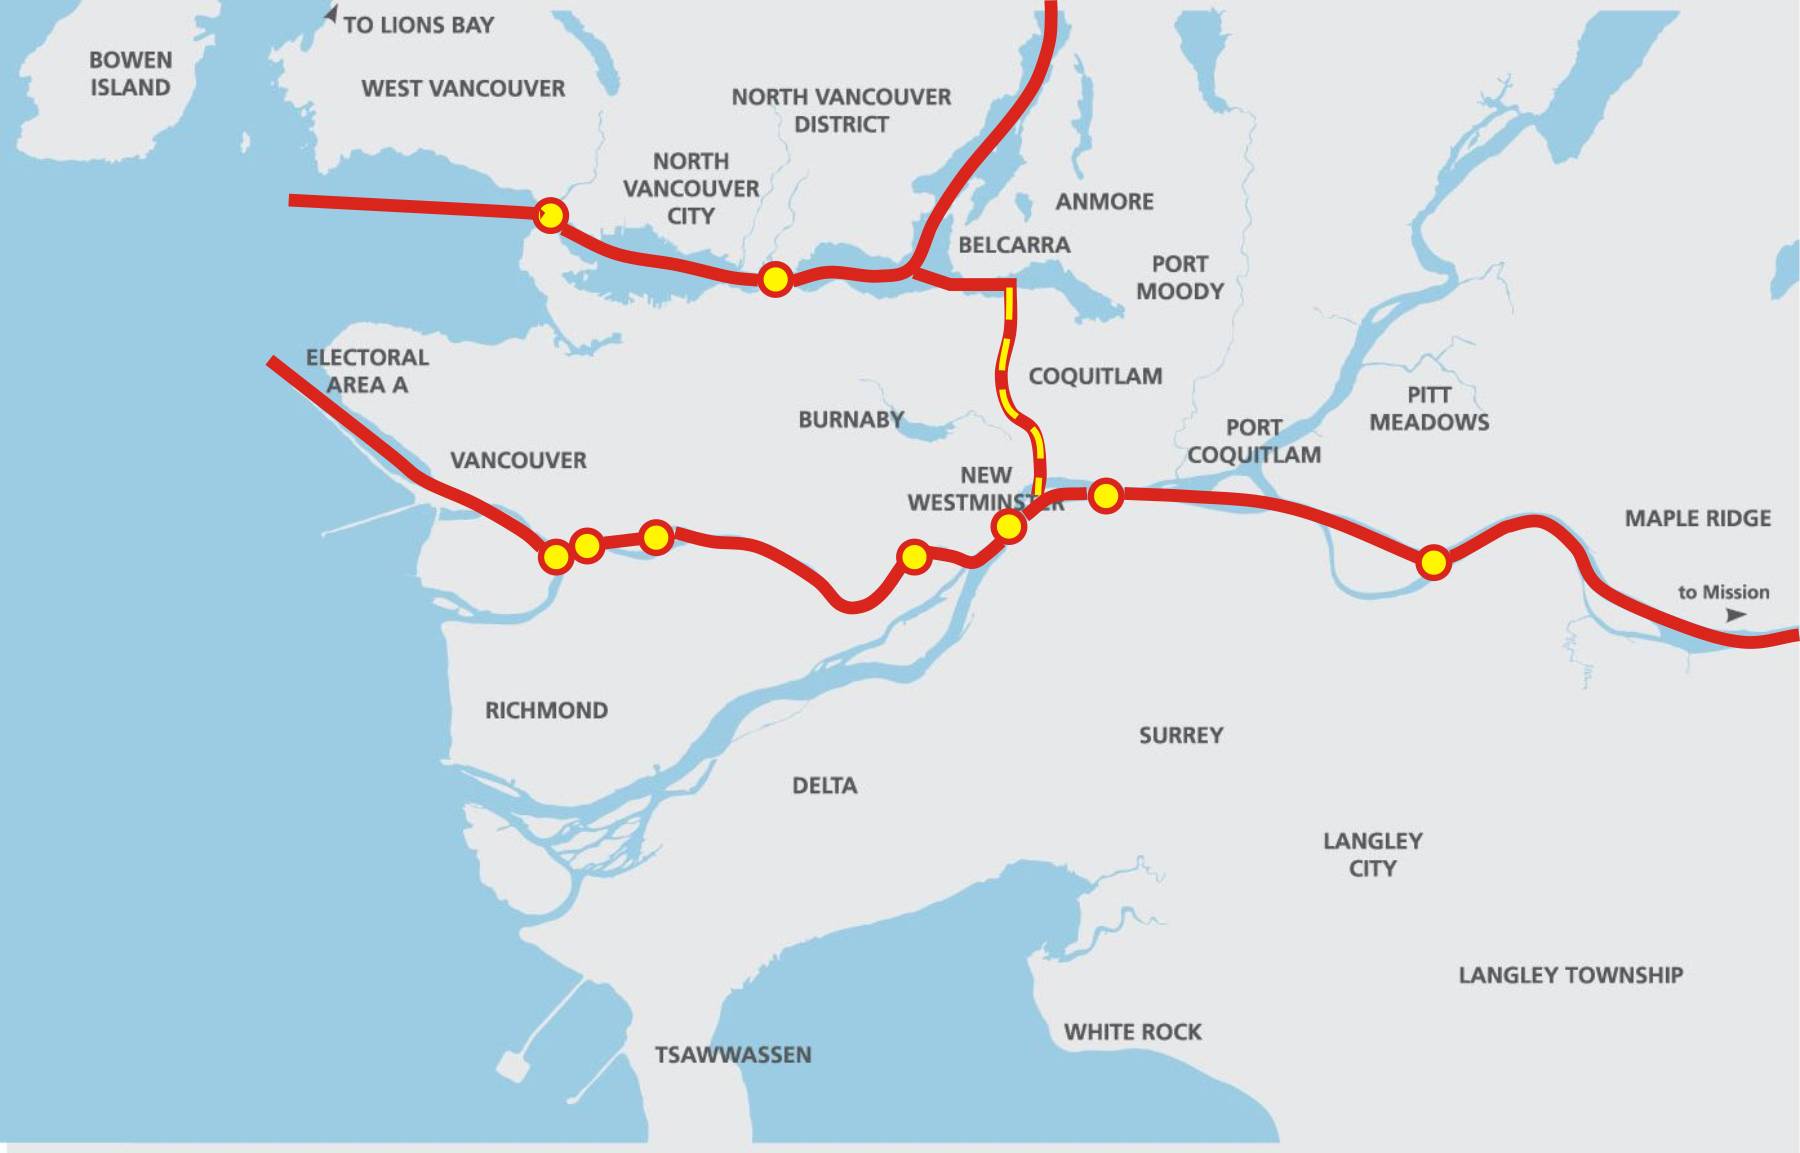
This is an important issue for our City. Although the pipeline as proposed does not pass directly through our City, it passes very close to us, and more importantly passes right through the lower reaches of the Burnette River watershed, within metres of the River itself. After 50 years of hard work by Elmer Rudolf and the Sapperton Fish and Game Club to restore this urban water way – to bring salmon back to a river that had been devastated by a century of industrial pollution and neglect – the Brunette is too important a resource to risk. So it is important that we had representatives taking part on the NEB review process. Our consultants were there to provide solid scientific back-up, and we had Elmer help with describing the threatened habitat from a first person perspective. Our goal all along was to make sure that the protection of the Brunette is part of the decision making by the Federal government about whether, and under what conditions, this project moves forward.

This is not an Environmental Assessment the way many may think it is – it is an evaluation of the project by the National Energy Board, currently chaired by the former Deputy Minister of Oil for the Province of Alberta, with members that represent the broad range of oil and gas industry interests. The (new!) federal government last month announced an extension of the NEB review process to allow other Federal Departments to fill some gaps in First Nations Consultations and upstream GHG emissions, so we don’t expect to hear a decision from Ottawa on this project until December of 2016.

Recruitment 2016: Century House Association Representative on the
Seniors Advisory Committee

The CHA always nominates a representative to our SAC, and this report formalizes that appointment
.
900 Carnarvon Street: Housing Agreement (Bylaw No. 7810, 2016)
The building proposed for 900 Carnarvon (the “4th Tower” at Plaza 88) went through a Rezoning Public Hearing back on September 28, 2015, and Council gave the Rezoning Third Reading. One condition on this Rezoning is that the building would be a market rental building, in part to address a rental vacancy rate bouncing around 1% regionally. This housing agreement will secure that market rental condition for the life of the building (60 years). Council moved the recommendation to give this Bylaw three readings.

320 Salter Street: DVP and DP for a 91 Unit Secured Market Rental Housing Project
Move recommendation This is another project in Port Royal where we are securing market rentals. The zoning was adopted back in 2014 (before I was on Council) and we are now at the Development Permit stage. Council moved to bring this Permit to the April 4 Meeting for an Opportunity to be Heard. C’mon out and tell us what you think.

New Westminster Child and Youth Friendly Community Strategy
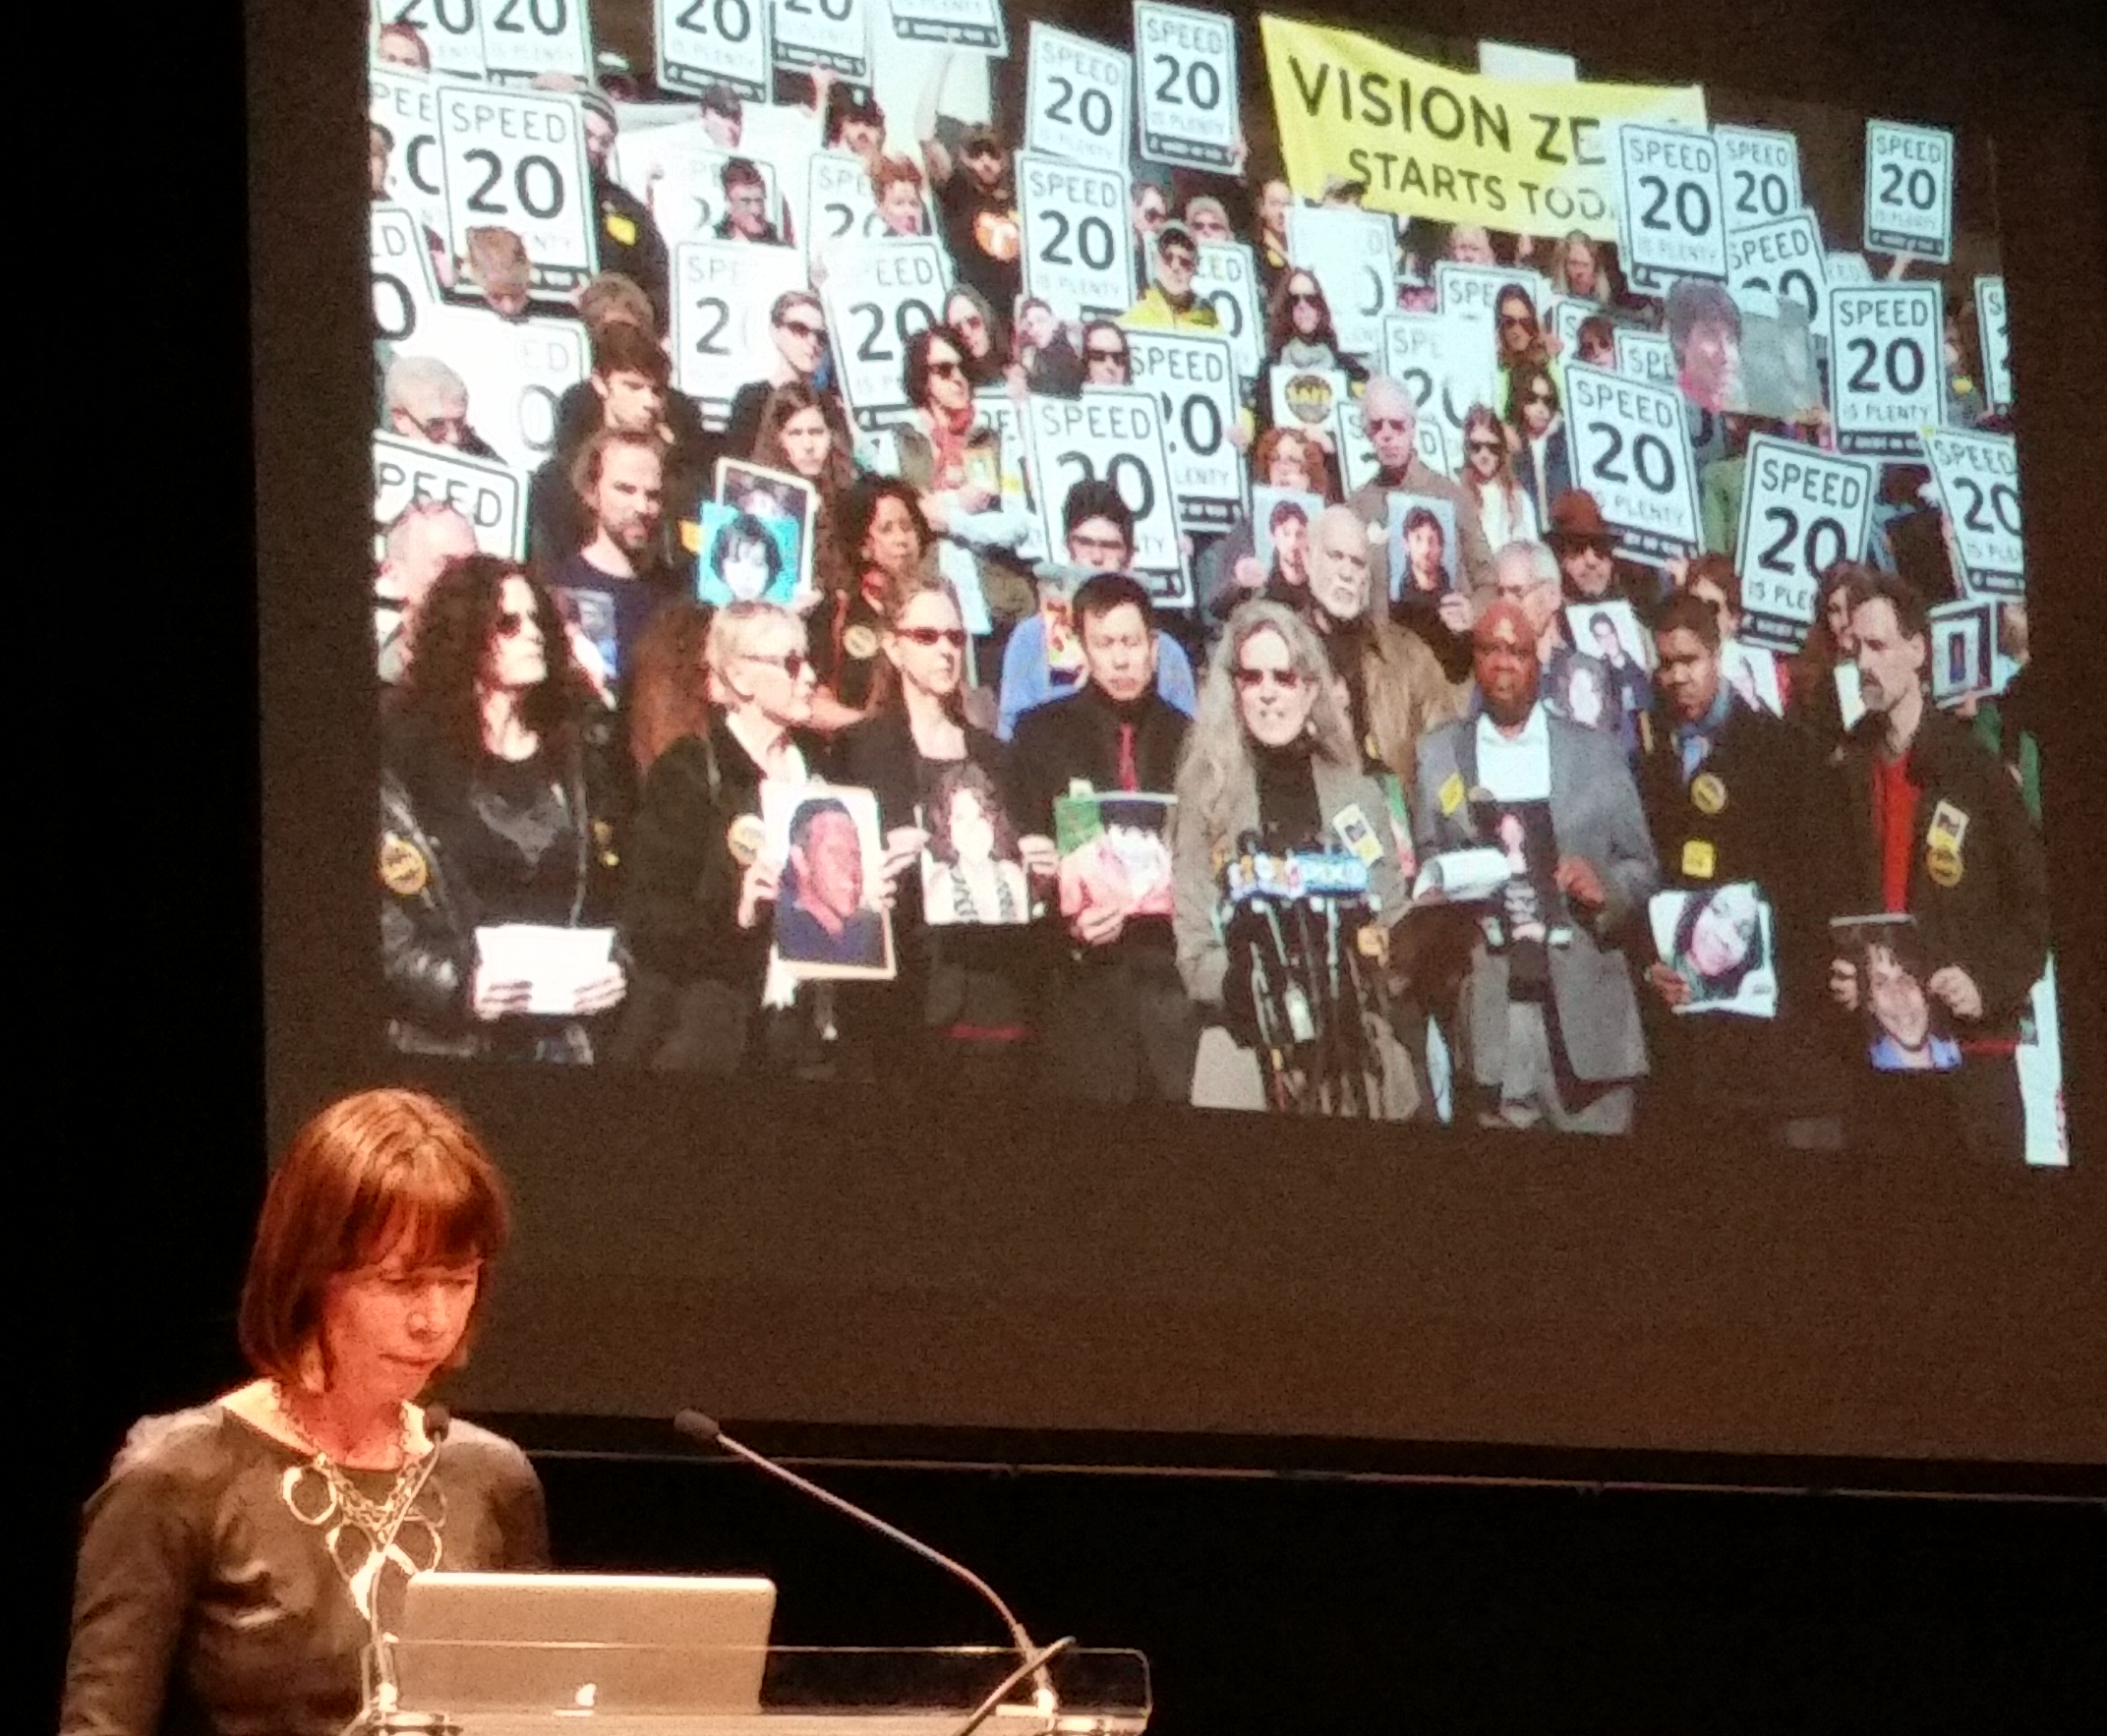
This is an interesting strategy the City has been working on in recent years to make sure our City has the infrastructure, programs and supports in place to be truly “family friendly”, by assuring it is a safe, supportive, and inclusive City for children and youth. There are a lot of good initiatives in here that will bolster our Family Friendly Housing Policy. I don’t have kids, but am keenly aware of transportation issues, so I am glad to see the strategy include a “Moving Domain” that addresses transportation gaps in the West End and Queensborough, safe routes to school, lowering speed limits and increased pedestrian protection in residential neighbourhoods,

Update on City Responses to Assist in Refugee Settlement and
Integration

There is a lot going on locally to support refugees that are arriving every day, including the work that social service agencies like ISS are doing (and have been doing for years before this latest crisis). Amongst other measures, the City has agreed to help organize and assist with financing of a “Newcomers Connect Day”, coming up in April.

The City is also working on updating our Newcomers guide, which includes materials to reduce barriers to local government, such as instructions on things many take for granted growing up here: what City does, where your garbage goes, when you should call police, how to get access to permits, parking, libraries, sports and recreation, etc.

235 Durham Street: HRA Amendment Bylaw No. 7817, 2016
This is an Agreement to amend a Heritage Revitalization Agreement prepared back in 2013 to extend the timeline for the restoration work, mostly due to the unexpected death of one of the parties to the agreement. Council moved to give the Bylaw which would allow the extension three readings.

Request for Support from Ladner Sediment Group
This is a group of residents and businesses in Delta who are mostly concerned that the Federal money for maintaining dredging in the Fraser River dried up under the previous government, not unlike almost every other program to support communities. Although the idea of advocating for dredging money is good for Ladner, I think that the larger dredging, flood control and diking program needs a basin-wide approach, and that is why New Westminster is active in supporting the Fraser Basin Council approach.

Additional Community Grant – Hyack Anvil Battery
The Ancient and Honourable Hyack Battery Salute is one of those quirky things about New Westminster that makes us unique. Every once in a while, we are asked to contribute a bit to help keep some of these traditions happening, and I am happy to support the renewal of uniforms for this organization. Our grants budget has a bit of unexpected room from last year, so this one-time grant is outside of cycle, but within our larger spending envelope.

2015/2016 Electrical Utility Rates
Yes, your New Westminster Power rates are going up 4%, in order to match the increase in wholesale cost for electricity in the City. A quick reminder about New Westminster Power: we pay the same rate per KW/h as other BC Hydro customers in the province, we have one of the most reliable electrical systems in the Province (notice how your lights didn’t go out during this week’s windstorm), and the Utility returns a small profit to the City coffers every year, helping to keep your taxes down. I think we have a good thing going here.

Filming Policy Amendment, Film Permit Bylaw No. 7793, 2016 and
Bylaw Notice Enforcement Amendment Bylaw 7814, 2016

We are updating our filming policy and are creating a new Bylaw to give the policy a bit of teeth. After a pretty minor edit following the last time this came tio Council, we moved to adopt the new policy and send the Bylaw for three readings.

1209 Hamilton Street: Proposed Rezoning
This duplex home just a half-block off of 12th Street is being set up to become a Day Care. It appears to be a good layout and location, but requires a rezoning. Council agreed to direct Staff to process the application as per usual, launching this plan into the entire Rezoning rigmarole. Coming to an Open House near you!

Brewery District: Rezoning Application and Master Development Permit
Amendment

This amendment to the Master Development Permit and Rezoning for the Brewery District has been back and forth between public consultation and Council for a bit, and this was one more chance for Council to comment on the changes.

Formally, the changes are to the density of the second residential building to accommodate some secured market rental, a change in density distribution (and height) to the third and fourth residential buildings, a density increase to the final phase commercial building, and a few accessory changes around land use.

I continue to be concerned about the traffic impacts here, and am happy to see that more is being done to move some access off of East Columbia. We need to shake off the idea that Brunette cannot be a used for access. I’m even happy, at this point, to see a controlled intersection installed on Brunette to further take the load off od East Columbia and discourage the use of Alberta, Kearey, and adjacent roads uphill from East Columbia from becoming commuter routes. The traffic/parking consultant for the project recommends moving access to Kearey Street, which may align well with RCH expansion plans, but a creative solution is required here as well, to prevent Kearey becoming a rat-running route. I hope Wesgroup will work with RCH to align their common approaches (and told them as much in Land Use and Planning Committee).

As much as I would love to see a Brewery at the Brewery District, I am cautious. I don’t know of another example in BC where an active brewery shares space in mixed commercial-residential development, and Breweries can be smelly and a little noisy at night. A Brew Pub or Tap house may be perfect, but an actual on-site brewery may need to be approached with caution.

École Qayqayt Elementary School Public Art Funding Request
I love this. I think this is a great use of Public Art funds. It is local, includes an educational component, is a permanent fixture, and is matched in finds with an outside partner. It is easy to say yes to this one!

The following items were Removed from the Consent Agenda for discussion:

Q2Q Pedestrian and Bicycle Bridge Review Process, Community Consultation
I feel like I have written a lot about this already, but here we go again.

I am a cyclist, a pedestrian, and have always been an advocate for sustainable active transportation, and for creating a permanent, fixed, reliable and accessible active transportation link between Queensborough and the Quayside. It is an important piece of the City’s waterfront vision, of our Master Transportation Plan, and for the development of our community in the whole.

However, this project is causing me more stress than anything else we are working on in the community today, mostly because I am very afraid we are not going to be able to build a project that is acceptable to the community.

The strong public support shown in 2013/14 consultation was for a design that we have now determined the Marine Carriers would not support – because it was low elevation, it was accessible, it had low visual intrusion and it provided reliable emergency vehicle access. One by one, we have removed those factors and are no longer building a transportation link, we are building a terribly expensive parks amenity. That would be a disaster. If we build a bridge that isn’t accessible and reliable for the ultimate users, it is going to be a lost opportunity.

So the design work continues, and the public consultation continues, but at this point I am hoping that the design consultants can pull a rabbit out of the hat, and can re-build my confidence that this project is still viable.

In the meantime, I think we need to re-engage with the Marine Carriers and the senior government agencies (Transport Canada and Port Metro Vancouver) that hold the navigable waters regulations. I respect the needs of the marine carriers and their expertise on marine operations, but the river belongs to all of us, and this community deserves and equal say in how our river is used.

I also put forward a motion to want to clarify the process for First Nations consultation. Although a pre-approval process through Port Metro Vancouver has initiated some discussions, I have learned through my participation I several Environmental Assessments over the last few years that it isn’t good enough anymore to tell First Nations what we plan to build and ask for comment. We need to engage their leadership early and make sure they are updated and aware long before formal discussion of design concepts are brought in. It is about relationship building, and I would prefer if we reach out Council to Council. This discussion should not just centre on the Q2Q, as this is an opportunity to check in and talk about the City’s Waterfront Vision in its entirety, and invite those First Nations to meet with the Council and discuss issues, concerns, and opportunities related to this bigger idea.

Ditch Infill and Urban Streetscape in Queensborough
The biggest issue in Queensborough (battling traffic and the general sense that “no one over there cares about QBoro” for that title), is how we are going to manage the remaining ditches in residential areas. The ditches are an important part of the drainage system for QBoro and Lulu Island in general, and also provide ecosystem services. Some people love the frogs and dragonflies, some hate the mosquitoes and murky water.

Filling in the ditches would require significant infrastructure costs, because an open ditch can hold and move a lot more water than a closed pipe that would easily fit in that ditch. Then you have to build curbs, gutters, storm catch basins, and connecting pipes, and in a place with no natural grades like Q’boro, you need to build grades and pumping infrastructure to keep things moving out to tidewater.

This report outlines the strategies the City will use to move towards closed drainage in the neighbourhoods where people want to go that way. Part of the cost will be on the city, some will be on developers who build new developments (and receive up-zoning benefits from that development) , and some by residents through special assessments.

We then moved on to the most exciting call-and-response part of every council meeting: Bylaws!

Film Permit Bylaw No. 7793, 2016 and Bylaw Notice Enforcement Amendment Bylaw No. 7814, 2016
As discussed above, these Bylaws regarding Film operation in the City was given three readings.

Electrical Utility Amendment Bylaw No. 7816, 2016
As discussed above, the new electrical rates bylaw was given three readings.

Housing Agreement (900 Carnarvon Street) Bylaw No. 7810, 2016
As discussed above, the Rental Agreement for Plaza 88 building 4 was given three readings.

HRA (235 Durham Street) Amendment Bylaw No. 7817, 2016
As discussed above, the Bylaw to grant this HRA extension was given three readings.

Erosion and Sediment Control Bylaw No. 7754, 2016
Bylaw Notice Enforcement Amendment Bylaw No. 7819, 2016

As discussed back on February 1, this Bylaw and the supportive changes of the Bylaw Notice Enforcement Bylaw were Adopted. It’s the law of the land, folks, please adjust your behavior accordingly.

Commercial Vehicle Amendment Bylaw No. 7777, 2016
As discussed back on February 15, this Bylaw on how we manage Taxi driver licenses was Adopted. It’s the law of the land, folks, please adjust your behavior accordingly.

HRA (205 Clinton Place) Bylaw No. 7800, 2016
Heritage Designation (205 Clinton Place ) Bylaw No. 7801, 2016

This Heritage conservation project went to Public Hearing on February 29, and the supporting Bylaws are now Adopted.

HRA (335 Buchanan Avenue) Bylaw No. 7802, 2016
Heritage Designation (335 Buchanan Avenue) Bylaw No. 7803, 2016

This Heritage conservation project also went to Public Hearing on February 29, and the supporting Bylaws are now Adopted.

And we were done!