Community (last week)

Another exciting week for the world’s most entertained City Councillor.

As you can see above, I went “All in for the Arts” at the Arts Council of New Westminster fundraiser at the Match Eatery in Queensborough. I was surrounded by Stephen O’Shea and Erin Jeffery, who are both incredibly generous with the thumbs-ups.

While fundraising, we were entertained by local analog electronic auditory waveform artist HARGOW, who also happened to perform at the Tenth (10th!) PechaKucha New West event on Saturday. This was (IMHO) the best PechaKucha yet, with stories that reflected so much that we love about community and about New West. The Mayor spoke, as did the coolest Malt Fermenter in New West. We had Renée Sarojini Saklikar stunning us with a personal poem about New Westminster history to Jen Arbo dropping the news about an exciting new venture where she hopes to see New Westminster’s future written.1

I had a Youth Advisory Committee to meet with (which made me feel every bit of my 46 years old), and attended a tour of a recently-built pool in an unnamed nearby community as part of my duties on the Canada Games Pool Planning Taskforce. We are deep into information gathering here, and hope to have some exciting news this spring.

6

I made a quick appearance at the well-attended VIBE event at the Anvil to try my hand at blackout poetry, but had to run to my curling game before the choir performance, which was disappointing, as I really love complaints.

Speaking of complaints, I went down to Front Street on Saturday to talk to a couple of the business owners. With the Parkade removal moving along fast, there have been a few minor glitches, but the City and the BIA are doing a lot of work to help the businesses down there keep operating, and to keep people knowing that you can’t drive your truck on Front Street, but you can still get down there and buy some wine or some coffee. Different business owners are having different experiences, but almost every one I talked to is really looking forward to letting the sun shine on their storefront for the first time in 50 years.

3

Everyone’s favorite brewery had a Founders Club celebration this week, the RCFM had their Annual General Meeting (exciting changes in 2015, lots of great new ideas for 2016!), and the Vancouver Foundation held their Neighbourhood Small Grants celebration for New Westminster at Century House.

If you don’t know about the Neighbourhood Small Grants, you should look them up. This is a great program where the Vancouver Foundation provides grants to a variety of small events, ideas, or programs in the region. They are easy to apply for, and granted every year, to help you run a block party, hold a community dance, start a sewing circle, or an art project where people put on a Fez and sit on a Chaise.2

So there is that.

More taxes – with colour!

My main argument last post was that New Westminster’s property taxes, on a per capita basis, are not out of line with the rest of the region, and are actually significantly enough below the average that the difference works out to a pretty nice chunk of money.

However, it was noted to me that we don’t actually pay property taxes on a per-capita basis, we pay per household. So I took the same sets of statistics from the BC Government site to see how much each City was collecting in taxes from Residential properties only (not business or industry), and compared it to the number of Households in each community, which is a statistic collected by Metro Vancouver for their own purposes.

table1crop
Total residential taxes collected by Municipality per Household (BC Gov’t and Metro Vancouver data)

As you can see in this colourful chart, New Westminster slips down into one of the lowest-taxed communities in the Lower Mainland in this comparison. We have a relatively low number of residents per household (2.28, compared to a regional average of 2.73) likely because of the larger number of rental suites and apartments in New Westminster than other Municipalities.

Although the presence of taxes irritates some people, the issue really arises whenever taxes are raised, so how do we measure up in the constantly-increasing-taxes department? Every year Council discusses a potential tax increase to keep up with inflation, growth, wage increases and paying for new programs. Again, the Province’s annual reporting is a useful dataset for comparing these increases between Municipalities, in this case the table called Schedule 703, which lists the annual “Total Property Taxes and Charges” for all Municipalities. I calculated the % increase every year for all 21 Municipalities, and to facilitate comparison between Belcarra’s $2M budget and Vancouver’s $1.4B budget, I indexed all of the taxes to the 2005 baseline, which I arbitrarily set at $100.

table 2
Taxes and fees collected by Municipalities, 2005 to 2015, as a percentage of the baseline amount collected in 2005.

As you can see, between 2005 and 2015, New Westminster’s taxes went up about 65%, which puts us right about the middle of the pack regionally. Anmore was off the scale in their increases, and Vancouver was (perhaps surprisingly to some) one of the most conservative in their tax hikes. To answer your question, I have no idea why Langley Township has that big jog in 2014, except to say that’s what the stats report, and it was an election year in Jordan Bateman’s riding!

These numbers, however, mask that over those 10 years, there was a lot of regional population growth, so as taxes went up, so did the number of taxpayers. Your individual tax increase as a resident of one of these Cities is not represented here, so I took data from Schedule 201 to track the rate of population growth with the same set-2005-as-100 indexing, and the same line colours:

table 3crop
Municipal population, as a percentage of the 2005 baseline population.

The data here is, unfortunately, a little choppy, as the BC Government does estimates between census years, and the 2014 Census leaves something to be desired. Why they reported no changes in population in 2013 or 2015, you will have to ask them. Perhaps most surprising are the 6 Municipalities that saw their population shrink since 2005 (we need to sit down and talk about the Regional Growth Strategy here, folks). As you can see, New Westminster was one of the fastest-growing communities, behind Surrey and Port Moody, and quite a bit faster than all of the municipalities to the north and west of us, even those with similar dense urban cores and rapid transit access.

So combining those two charts together, I calculated the “Total Property Taxes and Charges” (from Schedule 703) and divided by population (from Schedule 201), then again indexed the resultant taxes per capita to the 2005 rate, which I arbitrarily set at 100:

Taxes and fees per capita, as a percentage of the 2005 value.

Not surprisingly, taxes didn’t go down per capita in any Municipality over the last decade, but Vancouver’s rapid growth combined with its relatively conservative tax increases make them look pretty good, and they were the only Municipality whose tax increases were (at least until 2014) on pace with the National Inflation Rate, which I added as a dashed line, mostly for Ed’s benefit. Notably, only 4 municipalities (Vancouver, North Vancouver City, Langley City and Surrey) have increased their taxes at a lower rate than New Westminster. It is interesting that these are amongst the most “urbanized” municipalities, and that taxes are increasing fastest in more rural/suburban municipalities, a correlation I have no theories to explain.

As a summary, New Westminster is far from the most-taxed municipality, and are trending towards being one of the lowest-taxed. Based on BC Government data, I am confident that our taxes, no matter how you count them, are comparatively low, and our increases to date are low relative to the other municipalities in the Lower Mainland.

Tax time again

As it is budget time again at New Westminster Council, people will soon be asked to provide some feedback to our somewhat byzantine financial planning.

The feedback the City receives during tax time can usually be summed up in one phrase: Stop raising taxes. Unfortunately, that advice usually offers a paucity of practical suggestions of how to save the money, with the exception of a general idea that we need to fire some number of “gold-plated staff”. For every suggestion of a practical way to save money (“stop wasting money on flowers”), there are other suggestions or how poorly we prioritize our spending (“what happened to the flowers that used to be on the boardwalk?”)

This is an area where the City’s public engagement process could definitely be improved, but it may be the most challenging part of community engagement, because there are a variety of barriers between making municipal financing understandable to most people, while still providing a complete enough picture of how our budgeting works and where our your money actually goes. The City’s books are, by regulation and practice, completely open, but that doesn’t mean the data presented is put into a context that is useful for most people. This is augmented with a general lack of understanding of how municipal financing works, including the Public Service Accounting Standards, auditing, and formal reporting that is done by every City in the Province.

So to start the conversation here about the 2016 budget plan, I want to put to rest, once again, one of the myths we commonly here in New Westminster: that we are “The Highest Taxed City” in the Lower Mainland. To challenge that idea, I am once again going to the standardized financial reporting data that every City provides to the Province.

I have already talked about Mil Rates, and not much has changed since I wrote that blog post all them years ago – Mil rates are still a terrible way to compare taxes between Cities. Actually, pretty much any way to try to compare taxes between Cities is a terrible way. Every comparison includes some confounding variables hidden in the data, because (back to the top) municipal budgeting and taxes are a complicated topic.

So for the purposes of this post, I will provide a couple of charts showing that we are not, as some would assert, the highest-taxed City in the Lower Mainland. Again, all data from the BC Government sources cited above, which is about the most impartial source of data available for local government finances.

Table1
Residential property taxes collected in 2015 per capita.

Table 1 shows the amount of residential property tax paid to the Municipality per person who lives in the Municipality. This does not include taxes paid by industry or businesses, or other fees the City collects, but right off the top, you can see that New Westminster is no-where near the most taxed Municipality.

But this is only Residential Property taxes, and Cities vary somewhat in the amount of industrial and commercial taxes they collect relative to residential taxes.

Table2

As a bit of an aside, Table 2 shows how much of the taxation burden is carried by residential homeowners, relative to how much of the present assessed land value is residential. In every City (except those few lacking commercial or industrial taxpayers), the business community subsidizes the homeowners. The few Munis with almost all of their revenue collected from residential land are the anomalies, but the “gap” between tax burden and assessed land value here in New Westminster (~25%) is not out of line with that of our “competition” with similar tax rates.

Table3
All municipal taxes collected in 2015 per capita.

If we widen our focus away from only taxes collected from residential property owners, and put all municipal taxes (residential, commercial, industrial, etc.) into the bin, we end up with Table 3, the amount of municipal taxes collected from all sources per capita. Again, New Westminster is somewhere in the middle, skewing slightly (but probably not significantly) towards the lower-tax side of the spectrum. The Cities that moved up are (naturally) those with the largest commercial and industrial land bases. Vancouver moved up 11 places from one of the lowest-tax cities to 5th from the top, Delta from the middle of the pack to the second highest (thanks to their low population and the Annacis Island cash cow), while residential bedroom communities like Anmore, Lions Bay and (sorry) Maple Ridge move way down to where they look more like comparatively lower-tax communities.

However, there is one more way these comparisons of taxes are not fair between jurisdictions, and that is in the other ways some municipalities choose to collect money from residents and businesses. Fees, Local Area Service Taxes, and Parcel Taxes are ways that tax burden can be kept off the “Mil rate”, but still appear on your bill. These are, fortunately, reported to the Province, which allows a more fair comparison between the Cities (Surrey, Burnaby, Coquitlam) that collect millions in Parcel Taxes with others (Vancouver, Richmond, New Westminster) that collect none.

Table4

Table 4 shows what happens if these additional taxes are included with your variable property taxes, and the Cities are compared, again on a per-capita basis. Not only does New Westminster compare well against out neighbours, we are significantly below the average per-capita taxes for the region, shown by the dashed red line.

For the fun of it, I calculated what it would mean for New Westminster to raise its taxes to match the per-capita regional rate. To get there, we would have to collect $18.5 Million more every year, or $264 per resident. To put that in perspective, an extra $18.5 Million per year would pay outright for a new Canada Games Pool in 3 or 4 years, a new Animal Care Facility in less than 6 months, or enough money to raise our annual grant fund for festivals and other services by 20 times. That is a crazy amount of money, and that is the amount we are below the average for the region.

Do all cities charge too much taxes? Some would argue that, while other question whether cutting municipal costs to the bone is really worth the erosion of livability that usually results. And threading that needle, my friends, is where we need to have a better discussion around the City’s budget.

Community – Coldest night and more!

A busy week in the community even without Council Meeting. The Downtown BIA had their AGM at el Santo last Tuesday, and I had a meeting one evening with some residents on the Quayside concerned about the Q2Q project. I also attended the first NWEP Green Drinks get together of the year (pic above), which was my first chance to check out Rain City Juicery.

QPRABoth Councilor Harper and I attended the Queens Park Residents Association meeting, where there was a great discussion about the City’s OCP process and Heritage Preservation in Queens Park.

coldestWe had a quorum of Council show up for the annual Coldest Night of the Year fundraising walk for Senior Services Society of New Westminster. It was a slightly chilly but dry evening on Saturday, and it was great to get caught up with our MLA and MP, while raising money for a great cause!

Finally, I spent a lot of time at the Royal City Curling Club last week, playing my regular league game on Tuesday, doing my volunteer shift as bartender on Saturday, and then standing in on Sunday as Acting Mayor, when His Worship couldn’t make his league curling game, and he needed a spare!

Council Report – Feb. 15, 2016

Council Report – Feb 15, 2016

My Council meeting report is a little late, but its been a heck of a week, and with no meeting this Monday, I figured I would have some free time Sunday. Then my “Sunday without a Council package to read” came along and I slept in a bit, did some yard work, pruned a fig tree, put the compost on the garden, attended a Residents Association meeting, made my award winning meatloaf for dinner, and spared for a curling team in the evening. Time flies when you have free time…

But the belated report is finally here, and you can follow along with the Agenda here. We started by moving the following items on Consent: 

Amendment to the Delegation Bylaw
The City has a Delegation Bylaw, through which Council allows our Staff to make decisions, mostly smaller spending decisions, that are strictly the duty of the Council. This allows the City to operate more efficiently, as we don’t need a Council Report every time we order a ream of paper. As we are doing a bit or re-organizing within the City, the Delegation Bylaw needs to be adapted a bit to fit the new Org Chart.

Recruitment 2016: Advisory Planning Commission Appointment
The Advisory Planning Commission advises Council on planning applications to bring a broader community focus to those discussions. We have filled a recently-vacated position.

Recruitment 2016: New Westminster Design Panel Appointments
The Design Panel provides Council advice on the design and planning aspects of developments, and is usually populated with people with professional skills in those areas such as builders, architects, and landscape architects. We have filled two vacancies on the Panel

Recruitment 2016: Chamber of Commerce Representative to the Access Ability Advisory Committee
The Access Ability Advisory Committee has a spot for a member of the New Westminster business community, and we have formally accepted their nominated representative.

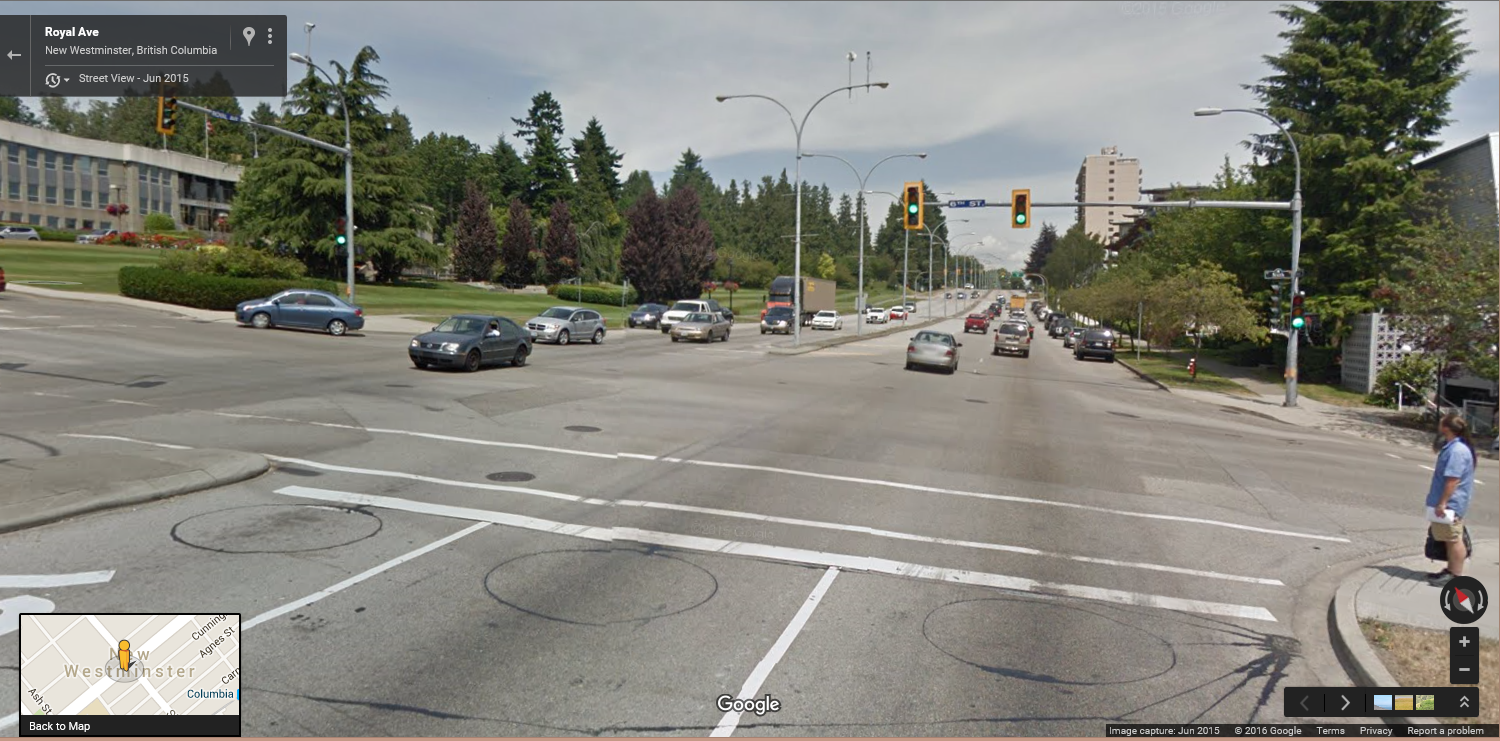
Official Community Plan Amendment for the (UC) Uptown
Commercial Designation:

The idea here is to increase the viability of 6th Street between Royal and Fourth Ave by providing more flexibility in how that stretch is developed. The thinking is that at-grade residential use here may enhance the commercial operations that already exist. This Report was just to get approval to start the statutory consultation for the required OCP amendment under sections 475 and 476 of the Local Government Act, which was granted.

320 Salter Street: Housing Agreement Bylaw
This is a Bylaw through which the aforementioned development on Salter Street will be secured as market rental units. As the Mayor was on CBC radio this week talking about the rental squeeze in the Lower Mainland, it is good to see the incentives that New West is providing is resulting in more developers looking at rental as a marketing strategy. Council agreed to give this proposed Bylaw 3 Readings.

After the Consent agenda, Council went through the Regular Agenda items, which started with a presentation:

Reflective Products for Non-Professional Road Users
After a presentation from Staff and Vic Leach, and a bit of discussion, Council moved resolutions to support calls for CSA standards for consumer reflective safety products, and to ask staff to draft a resolution calling on the Province to make 30km/h the statutory speed limit for urban areas. I’ve already blogged on that topic here with a little more detail, so I won’t belabor the point.

Front Street Security
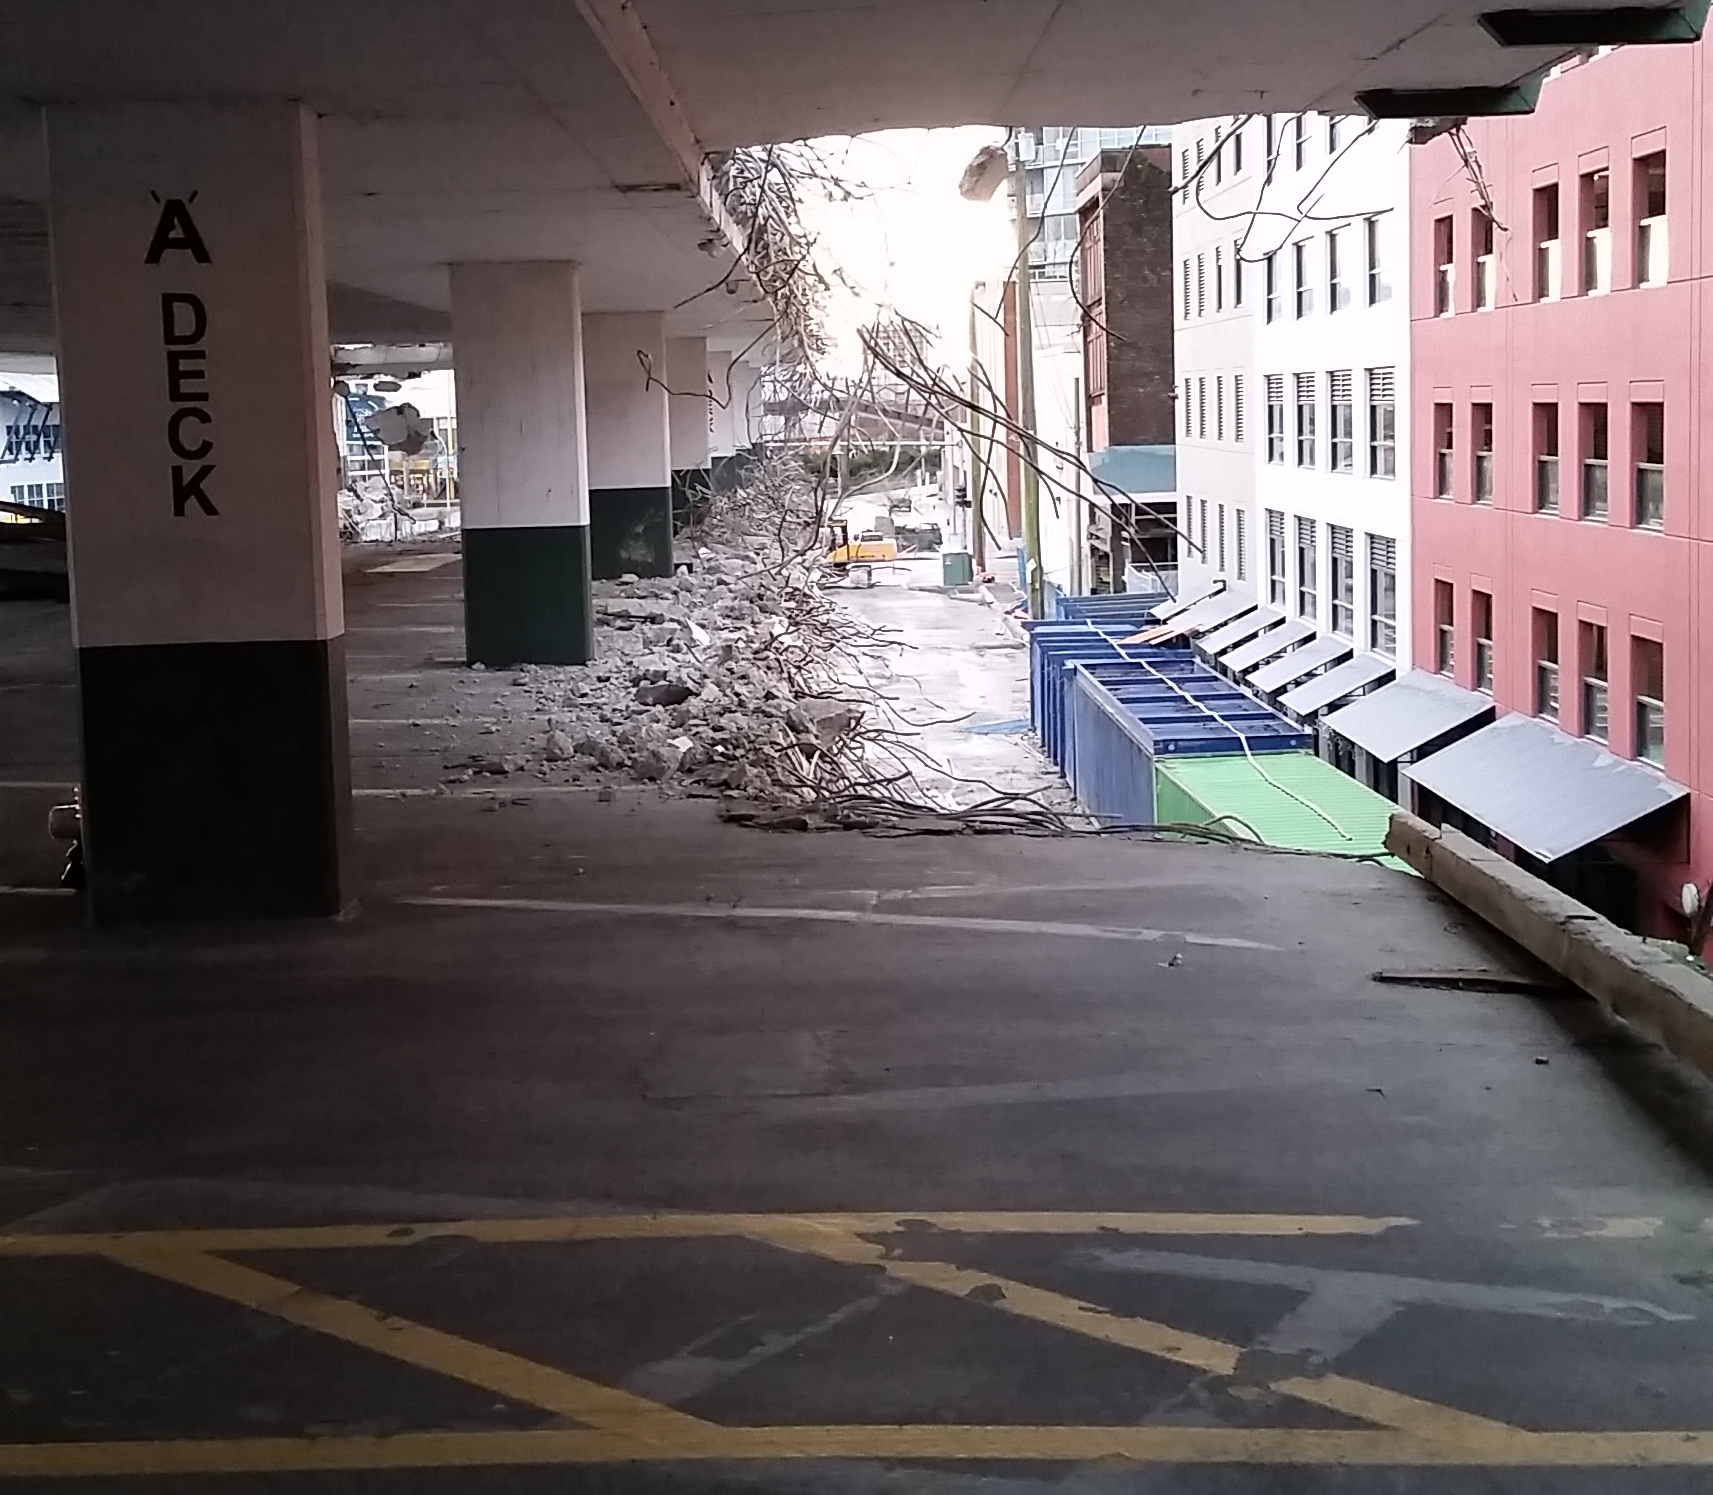
Councillor Puchmayr brought to Council the concerns of Front Street businesses around security issues around the ongoing work to remove the Parkade and build the Front Street Mews. Although the construction company has security, the NWPD has just begun to work with the businesses down there to improve come of the lighting and other security issues on this expanding construction area.

Port Metro Vancouver and Marina Fees
We had a delegation a couple of meetings ago around several City residents in Queensborough feeling pinched by rapidly increasing water lot rental costs from the Port. Council moved to send a letter of concern to the Port, and engage senior governments in a review of the recent, seemingly quite onerous, increases.

These items were removed from Consent for discussion:

Proposed Amendments to Commercial Vehicle Bylaw
Remember those discussions we had about Uber? This is part of the complex regulatory environment we were talking about that was designed to make the taxi industry safer and more accountable. After a couple of denied chauffeur licenses over the last year or two, staff have provided some feedback with suggestions on ways we can make the administration of our responsibilities under the Motor Vehicle Act better. Some amendments to the City’s Bylaw were recommended, that Council moved to support.

100 Braid Street (Urban Academy): OCP Amendment
This proposed development in Sapperton is beginning its public consultation process, and again, this report was to outline the statutory consultation process that all OCP amendments are required to follow (due to sections 475 and 476 of the Local Government Act), including senior governments and external agencies. The public consultation on this project is progressing quickly!

Metro Vancouver Draft Regional Food Systems Action Plan:
I went on a bit of a rant here, as food security is a major component of regional sustainable planning, and I am generally supportive of the regional vision being put forward by Metro Vancouver. Councillor Harper brought up the interesting link between food security and food waste, which dovetails with the good work that Danison Buan is doing right here in New Westminster to crack that troublesome nut.

There is another aspect of food security that we rarely talk about in New West, because we are one of the few communities with no ALR land. But that does not mean we cannot support the protection of life-sustaining farmlands in the region. The two largest threats to farmland and our domestic food security are the development of farmland for residential sprawl, and the re-purposing of farmland for industrial use. We need to continue to oppose both of these, and make it part of our food security policy.

The first threat is enhanced by the current emphasis on building our regional transportation system to facilitate sprawl – the insane proposal to build a 10-lane bridge to replace the Massey tunnel, even the proposal to increase road capacity over the Pattullo Bridge – act to facilitate further sprawl, in contravention of the smart growth principles embedded in the Regional Growth Strategy. This is part of the reason we are looking at an OCP update that allows more intelligent growth near the regional transit spine. We often hear in New West talk about the traffic impacts of that sprawl to the south and east of our City, because of the traffic impacts we continue to suffer because of it, but we rarely talk about food security and other aspects.

The second issue – the ideological position of the Vancouver Port Authority that we will achieve food security by replacing farmland with warehouses to move imported food around – is something that we again have to continue to oppose.

Metro Vancouver Draft Regional Affordable Housing Strategy
Council also moved a motion in support of the Metro Vancouver regional Affordable housing strategy. More to come on this soon, I hope…

We then read some Bylaws:

Commercial Vehicle Amendment Bylaw No. 7777, 2016
As discussed above, these are the changes to the Bylaw relating to how we regulate Taxi drivers in the City. Council gave the Bylaw changes two readings, and will provide a Public Opportunity to be Heard at our February 29 meeting. Come on out and tell us what you think!

Amendment to Delegation Bylaw No. 7820, 2016
As discussed above, these are the changes to the Bylaw relating to how we delegate powers to staff. Council gave the Bylaw changes three readings.

Housing Agreement (320 Salter Street) Bylaw No. 7805, 2016
As discussed above, this is the Bylaw to secure Market Rental as the housing use for this development. Council gave the Bylaw three readings.

And that, after the Announcements and the receipt of some correspondence, was council for the week. Which explained to people why some of us were in hockey Jerseys.

on 30km/h

We had an interesting discussion in Council this week about pedestrian safety, a particular concern of mine. And although I have not yet completed my Council Report for this week (its coming…I promise), I wanted to get some words out about this story, as it appears in the newspaper under my photo this week, so I expect some feedback.

The conversation arose out of some good work Vic Leach has been doing in the Sapperton neighbourhood about increasing pedestrian safety through encouraging higher visibility. I support his call for the federal government (through the CSA) to produce standards for reflective products, so that consumers who know when they buy what are essentially safety products, that those products represent an actual increase in safety. This is a great idea.

But I also need to emphasize that I do not think lighting up pedestrians like Christmas trees is the solution to road safety. Putting responsibility for pedestrian safety wholly on the pedestrian is a perverse form of victim-blaming, akin to asking if a cyclist run over by a truck was wearing a helmet, implying that if there was no helmet, the truck driver and crappy roadway infrastructure that made them share space was immediately absolved of blame.

Ultimately, the responsibility for the personal safety of persons sharing space with 1,500kg high-speed metal boxes should fall on the persons operating the 1,500kg high-speed metal boxes and the persons designing the infrastructure where pedestrian and the metal boxes are expected to share space.

As the City, we are responsible for creating those safe spaces, and we are working towards that goal. We have a long way to go, but the emphases in our Master Transportation Plan are on protecting the pedestrian and in making all forms of active transportation easier and safer. We are prioritizing our spending on those aspects, truly putting our money where our mouth is.

However, there is one proven way to improve the safety of the pedestrian realm that is (for the most part) outside of the authority of the City, and that is speed limits in residential and urban areas.

During his presentation to Council, Mr. Leach cited how long it takes a car going 50km/h to stop, how much distance a car going 50km/h covers in 2 seconds. But there is another statistic we need to talk about: a pedestrian struck by a driver going 50km/h has a better than 50% chance of being killed (up to 80% according to some studies)* where a pedestrian struck at 30km/h have a less than 10% chance of being killed. This does not even factor in the fact that the collision is more likely to be avoided if the car is going 30 km/h. The fact that Stockholm, a City similar to Vancouver in weather, size, population, and transportation patterns has such a remarkably lower incidence of pedestrian fatality is a product of many things, including the higher reflectivity standards in Sweden, but it is notable that pedestrian deaths dropped there in 2007, when urban speed limits were reduced to 30km/h.

It is my opinion, backed with a significant amount of accident research, that 50km/h is a dangerous and unsupportable speed for automobiles to be traveling on residential streets. If we want to take the next steps in supporting pedestrian safety, to make a real change to the conditions that cause 400 pedestrian deaths in Canada every year, 60 deaths in BC annually, we need to make changes to how the automobiles operate, not limit ourselves by making the pedestrians – the victims – more visible.

The Province has a “statutory” speed limit of 50km/h for municipal areas. A City like New Westminster may choose to do local speed reductions around schools, parks, or high-pedestrian areas, but there is an onerous requirement for signage to make this enforceable. I would like to see the statutory limit in urban residential areas reduced to 30km/h, and provide the Cities the authority to allow 50km/h on major arterial streets where they see fit.

The potentially most effective way for us to move this forward as a City is to get the Lower Mainland Local Government Association to pass a resolution of support, then take that resolution to the Union of BC Municipalities meeting, where the municipalities can actively lobby the Provincial government to make the change. That is the path we will be hoping to take.

The safety of our citizens is, and should be, the #1 priority for all local governments, and the demonstrated safety benefits of 30km/h make this a no-brainer. I hope we can get it done!

*here is a list of studies, if you don’t want to take my word for it.
A great literature review from the NHTSA in the USA;
A recent published study with slightly different results;
Research from Australia;

Community – update!

So I haven’t been blogging much, but I have been busy running around town doing things that don’t leave time for the writing about them. One thing that has been pointed out to me is that I haven’t updated that gallery on the bottom of the page with my smilin’ mug in various places in the community. So this post will (hopefully) re-start the regular blogging of Community events I am attending.

There are a few reasons for this, other than my vanity.

I was recently reminded by a long-time Council TV watcher that Council doesn’t really do “council reports” at the end of our meetings, telling everyone what we have been up to over the last couple of weeks, and to many people the idea that Councillors are doing something outside of Monday meetings is really important. Community events are part of the schedule, and we always have more invites than we can possibly attend, so I guess there is a benefit in people knowing what I attended. Secondly, as a politician, I am supposed to make sure there are lots of pictures of me doing things, again to dispel ideas that I am sitting at home doing nothing. Thirdly, I hardly get to talk to my Mom these days, so it is nice that she can receive periodic confirmation of my still being alive. (Hi Mom!)

So here are a few recent events:

1p
MsNWimby and I collecting goods at the winter Royal City Farmers Market, with Market Manager Melissa Maltais
1q
Hanging with Danison Buan at the Hyack President’s Tea in Sapperton.

where

Meters and Metres of Water

Last Council Meeting, the New Westminster Environmental Partners brought a presentation to council on the topic of water conservation. I summarized Council’s resolutions resulting from that discussion in last week’s report, but it is worth expanding on the topic.

Full disclosure: I was actively involved with the NWEP before I was elected to Council, and even served as President for a few years. I have been less involved since I got elected, but am proud of the work we did in this community, and am supportive of the continued work the NWEP does.

The ideas that the NWEP brought first to the City’s Environment Advisory Committee, then to Council with that Committees’ recommendation, were a result of last summer’s unprecedented drought and the Stage 3 water restrictions. Those events saw most lawns in the City turn brown, and had many of us wondering if this was going to be a new reality with the double-whammy of population growth and climate change pushing our reservoirs to the limit.

It was a rainy day in February when Council talked about this topic, but much like it is easier to patch your roof when the sun is shining than when it is leaking, Council sent recommendations back to staff to review and update our water conservation approach in preparation for the next dry season. The approaches could be summed up as the stick, the carrot, and the meter.

The Stick

If I can characterize a common theme at the Environment Advisory Committee, there was frustration expressed about a perceived lack of enforcement in New Westminster during the water use restrictions in the summer of 2015. I think we can all remember noting a lawn or two that was spectacularly green in August, against all odds. On early-morning Sunday FR Fuggitivi bike rides through New West and Burnaby, we saw a lot of sprinklers or tell-tale wet asphalt deep into Stage 3.

For most situations dealing with taxpaying citizens and Bylaws, the City understandably takes an education-first approach. Make sure people violating bylaws understand they are breaking the law, order them to stop, then pull out the fine book if these approaches don’t work. The cost of enforcement Is rarely covered by the fines that can reasonably be applied, social pressure is essentially free, and many more people are obtuse of bylaws than deliberately flaunting them.

However, there are scofflaws, and for them the Bylaws need to be enforced. Council asked staff to report back to us on how the enforcement issues was managed last year, and whether Bylaws Staff had the tools they needed to make enforcement as easy as possible in the event of restrictions in 2016.

The Carrot

Different cities have different levels of water-conservation programming. In New Westminster, rainwater collection barrels are (were?) available from the City’s public works department at a discounted price, so gardeners have a little extra supply around. Other cities have in the past offered “water savings packages” that include things like aerators for your kitchen sink, low-flow shower heads, and spring-loaded outdoor faucets, or rebate programs for those switching to low-flow toilets, in order to incentivize the reduction of water consumption year-round.

I’m actually a bit embarrassed to admit I had very little knowledge of what type of incentive programs like this New Westminster has in place. We asked staff to report back on opportunities for active conservation programs, and to provide a bit of analysis about what works best elsewhere. Hopefully we can high-grade the best ideas from other jurisdictions, and bring them to New West.

The Meter

A basic truth of resource management is that you cannot manage what you don’t count. When it comes to managing our limited resource of clean potable water, water meters are the basic tool of conservation.

In New Westminster, all commercial and industrial users are metered, and pay for their water per cubic metre consumed. Every multi-family residence is also metered, and residents may pay by the cubic metre or a bulk rate to their property manager. Only single-family residences are currently not metered, with all houses paying a “flat fee” for a year of water service. Those with legal secondary suites pay 50% more for their flat rate, to pay for the alleged extra use of their tenant, and some seniors living alone get a discount on the presumption that they use less water.

According to a 2008 report done by staff on this very topic, about 80% of the water hook-ups are not metered, however almost 75% of water use is metered through our existing system. The largest pipes are metered, if not the majority of pipes. It is also reported that New Westminster has one of the lowest rates of water use per capita in the Lower Mainland, but that doesn’t necessarily mean we have the most conservative practices. Compared to most Cities, we have a general lack of large industrial and agricultural users, and have a high proportion of our population living in multi-family dwellings, where water use is typically much lower. These facts point to why we have not been all that motivated in the past to implement a potentially-costly universal metering program, but some things have changed since 2008.

First off, Metro Vancouver (who supplies all of our water) have indicated that they are going to be studying whether mandatory metering is something they may require for their customer municipalities. The 2015 shortage and monumental capital costs required to expand our reservoirs may force their hand, which may in turn force our hand. It serves the City and our rate payers if the City is prepared for this eventuality.

Second, the cost of water per cubic metre from Metro Vancouver has gone up substantially, as will the cost of receiving and treating our liquid waste (which is directly related to the volume of water use). Where the cost of saving water has in the past been overshadowed by the cost of implementing a large-scale metering program, this gap may be closing. Especially as more municipalities move towards metering, and the technology costs come down.

Council asked staff to update the 2008 report, and provide us some models for how a voluntary or mandatory metering system for single family homes might be implemented and operate in New Westminster.

Most of the feedback we have heard so far is positive, and I am reflexively in favour of water meters for all single family homes (including my own). However, I need to emphasize that Council has not made any decisions about this other than to explore the idea, and there is a lot of work for the City to do, including costing, engineering, planning and public consultation, before we have a deliverable program. In the meantime, take shorter showers, ok?

Ask Pat: Crappy Park

Someone asked—

Hi Pat, I am just inquiring about Sullivan Park on Oliver Street here in the Queen’s Park neighbourhood. It is a lovely park and really close to our home. However, I am noticing that there is a lot of dog dropping being left all around the park. I am not sure if this particular park is monitored but something needs to be done. It is horrible. I refuse to take my 14 month old there anymore as I am worried he is going to fall into it.. or worse. Anything you can do for us?

Shh! I didn’t think we were allowed to talk about Sullivan Park. It’s one of those neighbourhood secrets that we aren’t supposed to let anyone know about.

One general rule about a persistent dog-crap problem in a location is that it is probably just one person. Most dog owners are responsible and don’t want crap lying around any more than the rest of us, but one or two bad apples definitely can result in a lot of… uh… road apples. Unfortunately, catching that one person is probably near impossible.

My first suggestion is to use SeeClickFix when you run into a problem like this, to make sure it gets onto the City operations radar. If you aren’t a smart-phone lover, you can use this on-line form to make sure your issue gets tracked and followed up on. Or call Parks, Culture and Recreation at 604-527-4567.

What can Parks do? That is definitely a small park, and we have limited staff, so 24-hour patrols are not likely in the offing. I am not as familiar with Sullivan Park as my Queens Park neighbours, but having a doggie station with a ready source of collection bags, trash receptacle and signage will usually help most people do the right thing – if the park doesn’t have these at the one or two most common entry point, that may help. Of course, it may also encourage more people to see Sullivan as an unofficial “dog run”, which comes with its own issues.

As it is a unique spot, with a relatively small group of users (until you went and let the secret out!), it might be interesting to see if the neighbourhood has any ideas how to approach the issue. Better signage? Neighbourhood dog-watch? As a non-dog owner, I’m happy to hear suggestions!

Curb Extensions

Sorry, I’m not blogging much, and I would insert the usual “I’m too busy!” excuse here, but my busy-ness right now is at least partially because I have been doing a little better on the work-life balance thing and have spent some weekends away. I’m sure I’ll fall off the wagon soon, but here is something to hold my readers (Hi Mom!) over.

This is the beginning of a (possible) blog series that grew from a single post on the “Rattled by Traffic in New Westminster” Facebook Group. A regular Poster there, member of the Neighbourhood Traffic Advisory Committee, professional driver and all-around good guy Dave Tate wrote a comment that summarized a series of common questions in the City about traffic planning. I genuinely enjoy talking traffic with Dave, both agreeing and disagreeing with him, as he brings a pragmatic and relatively dogma-free approach to “the traffic issue”, which is pretty rare in this City. Anyway, upon reading his rant long list of suggestions, I commented that it was too much to digest on Facebook, but I would chew on it and provide a Blog response or two. This is the first, on the topic of curb extensions, and I hope I can get around to touching on the others in future posts.

Dave’s (slightly paraphrased) comment was:

Curb Extensions. I understand their purpose and I do agree that they have a use. Having them in places like 12th St between 10th and 6th on the side streets is a good idea. They help protect pedestrians by making them more visible in uncontrolled intersections. But installing them on Royal and 6th at a controlled intersections is a bad idea. If you had a right turn lane there it would allow cars turning to get over and allow others to pass, rather than stopping an entire lane of traffic.”

With all due respect, I think you only understand part of their purpose, and some purposes are different on Royal than on 12th. Arguably, they are *more* important on Royal, and have more uses. I’ve written this before, and there is a significant amount of published information on the value of curb bulges or extensions, or whatever you want to call them, from the fact they lead to better yield compliance by drivers to how they improve overall safety in the urban realm. However, aside from the dusty boring research, I’ll quickly summarize what I see as the benefits of the specific curb bulge at Royal and 6th, as that one commonly comes up in conversation.

First off, it is a tremendous aid to pedestrians when you have a road like Royal Ave. There are six lanes of traffic (including turn lanes) and a significant median, all on a hill. With the curb extensions, the crossing length is almost 30m. For you and I that is no problem, but not everyone is as young and spry as us. Reducing the crossing length by 6 or more metres at each end makes it more accessible and safer for users from 8 to 80.

Royal6_1

Those extra metres have another effect. The timing for a walk cycle is measured based on the distance of the crossing, and a general flat-ground rule of thumb is 1 to 1.2m per second. By adding curb bulges we actually reduce the amount of time that drivers face a red light, and increase the green light time for the cross traffic, increasing the efficiency of the traffic signal cycle for everyone involved.

Another benefit is by extending the radius of the corner, so right-turning drivers have a less extreme curve, and have better visibility through the turn, which significantly improves the safety of pedestrians from being clipped by right turners (one of the most dangerous interactions for pedestrians).

Also, curb bulges tend to slow drivers down when they enter an intersection, regardless of their intended direction (turn or straight through). This is because the narrowing creates visual “roughness”, making the road appear narrower than it actually is, which causes drivers to self-regulate. This is one of those basic road safety concepts: wide straight streets lead to higher speeds and more dangerous conditions for all road uses.

Now back to those right-turners. Why do we want them to skip the queue when traffic is backed up on Royal? Part of the traffic management goals of the City that pretty much everyone can agree on is that through-commuters should be encouraged to stay on the major routes, and not avail themselves of our residential side-streets for their daily rip through town. But you know if you are that through-commuter coming down Royal one morning and see the line-up of 10 cars at the red light, you are more likely to take that empty right-turn lane and go up 6th, and maybe turn left on Queens or Third or Fourth and try to get to Stewardson or places west. Of course, it is a fools errand, because as you mentioned, there is traffic calming in the Brow neighbourhood to make this choice less appealing, in order to make those residential neighbourhoods more comfortable and safe for the people who live and walk there. So it is easier of everyone if people stay on Royal in the first place. The curb-bulge does not reduce through-capacity (unless we made it a through-lane, not a right-turn lane, then we need to talk about making Royal 4 lanes, which is a whole different discussion). Creating a queue-jumping lane for rat-runners is not a great reason to remove a structure that provides so much pedestrian benefit.

So, yeah. You may have to wait an entire light cycle to make the right turn on Royal, and I’m sorry about that. But if that is the cost we have to pay for the multiple safety and neighbourhood benefits provided by that curb bulge, then I’m happy with the choice we’ve made.