I loved Fletch – the books and the movies. The books were darker and more cynical than the Chevy Chase vehicle, but I thought Chevy did his best work in the first Fletch. So please accept that my fandom may colour comparison of the investigative reporting skills of the fictional Irwin M. Fletcher with the hackneyed opinion making of BC’s own Tom Fletcher.
The columnist for Black Newspapers is predictably right-of-centre and comes from a free-enterprise-uber-alles all-government-are-clowns viewpoint. No problem with that, people have opinions, and I don’t expect everyone to agree (look at some of the crap I write – if you don’t disagree with me sometimes you just aren’t thinking!), but I’m a local blogger, he is a regionally syndicated Professional Journalist.
His recent column in the print version of the NewsLeader (and syndicated Province-wide) shows that he isn’t a very good one. I wanted to go through line-by-line and talk about the hundred types of wrong in this column (“Robert Redford!?”), but it just got too deep and too boring, even for me. So this long post is a few thousand words short of where it should be. You get what you pay for.
In this column, the estimable Mr. Fletcher attempts to fix some of the “ignorance” he has seen and heard in discussions questioning merits of Oil Pipelines. These misconceptions are being “exploited by some opponents”, and he wants to set the record straight.
Fact checking is an important part of the profession of Journalism, so we should thank him for his efforts.
Except that he gets pretty much everything from that point forward wrong. Not just the facts, but the part about being a professional Journalist.
Again, I don’t want to go through this line-by-line, but let’s take the major premise of the first half of his column – oil pollution ain’t so bad – and do a little fact-checking.
“A global study by the Smithsonian Institution in 1995 calculated the amount of oil making its way into oceans this way: Big tanker spills accounted for 37 million gallons a year, about five per cent of the total marine oil pollution identified.
“By far the largest source was oil runoff from land into drains, from oil changes, municipal and industrial wastes and other sources: 363 million gallons. Bilge cleaning and other routine ship maintenance added 137 million gallons, four times the tanker spill average.
“Air pollution from vehicles and industry deposited hydrocarbon particles equal to another 97 million gallons; natural seeps added 62 million gallons; offshore drilling discharges accounted for 15 million gallons.”
It’s nice that Fletcher gave us a reference, a global study by the Smithsonian Institution published in 1995 should be easy to find. It also tells us where he might have got the information from. Presuming Tom gets his “information” from the Internets, he might have picked it up from here or here. Or, even more likely, he got it directly from his buddies inside the BC Government.
Notably, that’s not where the actual data came from. The citation the BC Government provides does not link to any Global Study, as no such study was performed by the Smithsonian. Or anyone else in 1995 for that matter. The numbers come from a 1995 travelling science exhibit put together by the Smithsonian to teach about Ocean Ecology.
I’m not sure how many oil-industry spin cycles this dataset went through before Tom pulled it out and hung it on the line (and, problematically, neither does Tom), but hey, he’s a Professional Journalist – and it would have required a few more Google clicks to look for the original Smithsonian display text, and follow their citation
“National Research Council (2002) Oil in the Sea: Inputs, Fates and Effects. Washington, D.C: National Academy Press, May.”
Now we are getting somewhere. The National Research Council is a public research body, so the source of the data is available on-line, and we can assess the quality of the data (you know, Tom, like real reporters do). We find that there is no actual report that fits the above citation perfectly. There is a 2003 report by the NRC called “Oil in the Sea III: Inputs Fates and Effects”, which is pretty close:
“Oil in the Sea III: Inputs Fates and Effects, 2003”
It would be hard for a 1995 travelling science show to cite a 2003 paper, even with the Smithsonian’s money, so we need to go back to the older report “Oil in the Sea: Inputs Fates and Effects” done in 1985, which is also available here:
“Oil in the Sea: Inputs Fates and Effects” 1985
You can read the whole thing (it is interesting!) but maybe for the purposes of this post, just skip to the table on page 82, which lists estimates of Global input of hydrocarbons into the oceans. This looks good.
Also notice the text around the report about the meanings of each of the inputs, you really need to spend a few minutes putting this study into context. Then look at the similar table in the 2003 report I linked to above (the table is on page 69) – and note the long discussion about how far off the 1985 estimates were, and for what reasons. I put together this handy table so you can compare the numbers Tom chose to hinge his entire argument on, with actual data from which he allegedly got his numbers.
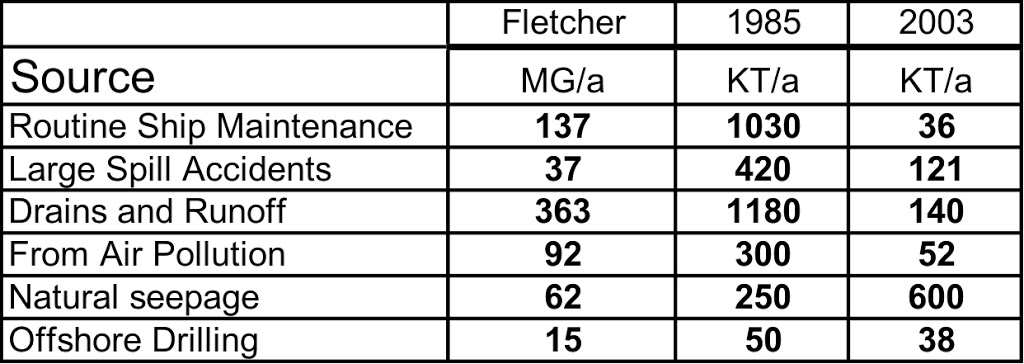 |
| “Fletcher” are the numbers Tom regurgitated uncritically “1985” are the best estimates from the 1983 report, converted from million tonnes to kilotonnes. “2003” are the “best estimates” for global inputs from that report. |
It doesn’t matter that the figures are in different units (Millions of Gallons versus kilotonnes), because his argument hinges on comparisons of oil spills with other inputs, so I decided not to do the conversions so I won’t be accused of misquoting the tables or cookingthe books. You can still compare the three sets of numbers on piecharts:
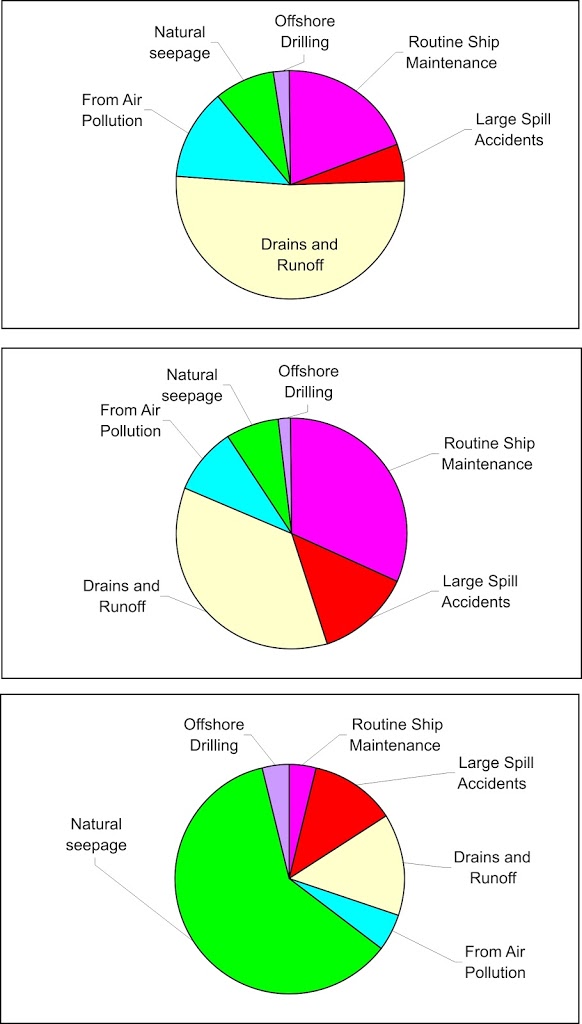
You can see there are three very different datasets. Which do you have the most faith in? The most recent study that built on the older study while acknowledging the flaws, or the random numbers presented by well-meaning science educators in 1995 from an flawed at-that-time 10-year old study? Which set of numbers did Tom run with? If you were a Professional Journalist, which would you use in order to address “misconceptions” that are creeping in to the Pipeline debate?
You may ask “So what? Who cares if his data is shit?”
I would say that even if it weren’t built on crappy data – his argument is flawed! The data is almost 30 years old, so the “oil runoff from land into drains” in the 1985 report included industrial waste runoff – primarily from petrochemical industries – and other waste streams from operations that are clearly not done by “you and me”. These are coming from things like oil terminals and refineries similar to the one his boss wants to build. I’m not sure how making statements like “Bilge cleaning and other routine ship maintenance added 137 million gallons, four times the tanker spill average” is supposed to endear us to having a tanker terminal on BC’s Northwest coast – why worry about a spill if bilge cleaning will cause more oil pollution!?!
This is also built on the premise that a little bit of oil spilled into a thousand small streams will have the same impact as millions of litres of oil spilled into one estuary. This is simply false. The impact of a single spill event can be catastrophic, and the minuscule amount of hydrocarbons in street run-off is less than optimal, but is generally metabolized and dissipated on the ocean before it can have harmful effects on the ecosystem.
I’m not minimizing the problem – Municipal runoff is generally bad stuff with trace levels of metals and hydrocarbons – but through significant changes since that 1985 report (oil and oil filter recycling programs, oil-water separator systems in storm drains, AirCare and similar emissions testing programs that remove unburned hydrocarbons from exhaust, standardization of dry-clean-up methods in the automotive repair industry, Laws regulating the handling and disposal of dry-cleaning solvents, etc. etc.) the situation in 2012 is way better than it was. I digress.
Admittedly, this is not an Investigative Journalism piece- it is an opinion column. So maybe I expect too much of a Professional Journalist writing an opinion piece to spend 5 minutes on Google to see if his data is correct (because that is how long it took me to collect the data above and demonstrate that his data is crap).
I fear somewhat that it is the data being used in a technical memorandum prepared by the BC Government, but that’s an entire other blog post.
I am going to give Fletcher the benefit of Hanlons Razor, and assume he is an incompetent and lazy journalist, and not intentionally using crappy data because it better makes the point of his “opinion”. Incompetent or lying, it hardly makes a difference, I’m not sure why Fletcher’s opinion is something anyone would find worth reading.
PS: By the way, “Cambridge Energy Research Associates” is not associated with Cambridge: the university or any of the universities based in Cambridge, Mass. It is the “energy market consulting” wing of the publicly traded industry publishing corporation “Information Handling Services”, or “IHS Inc”. It doesn’t take long on their website to see who butters their toast. And the study to which he refers “Oil Sands, Greenhouse Gases, and European Supply: Getting the Numbers Right” does not actually agree with the numbers Tom provides in his column. Those numbers are actually from page 6 of a recent Shell Oil pamphlet talking about how great Bitumen Sands are, which in turn cites the CERA… Yep, he did it again.
Hanlon’s Razor is looking pretty dull these days.
Thanks to Patrick Johnstone for locating newer figures on the sources of oil into the global marine environment, which he analyzes at length on his blog. I regret using figures from an older study.
However, the newer figures also reinforce
the point that tanker spills are a small fraction of total oil pollution. I guess that’s one difference between a blogger like Patrick and a journalist like me. He spends great effort to ridicule me. I’m more interested in understanding the problem and the possible solutions.
I like this new type of accountability. The internet has finally produced a way to critique the quality of journalism.
Whoever is right or wrong, it is healthy. Journalists have abused their public trust, from WMD in Iraq to BC Rail being sold behind a lie,journalists need to up their game.
I applaud the time and effort this blogger has spent.
Thanks for taking the time to respond, Mr. Fletcher.
With all due respect, ridicule is different than criticism, if I edged to close to the former, I apologise, but I don’t apologise for the latter.
To respond to the other commenter here, it really didn’t take me much time or effort – literally 5 minutes on Google to find the actual source of the data. What takes more than 5 minutes is to read and understand those studies, then frame your ideas an opinions around the results – as opposed to the other way around, where you have an opinion and dig for quick data to support it. It is that part that is supposed to separate journalists from every idiot with an opinion.
It also takes time to get past quick table of numbers lacking context, and glean from the information within the study which explains what the numbers mean. It is actually a fascinating paper.
Like how the numbers for “runoff” (a fundamental part of your argument) are vanishingly small in places like BC West Coast compared to places like East Asia (where we seem to want to ship our oil- exacerbating the problem), or how out ocean drilling has moved to deeper locations with fewer controls than we were 10 years ago, so the numbers from the 2003 report themselves are probably well past due?
But I am getting deep into minutiae, as my main criticism is that the standard of assuring the source and validity of your data is set up by you when you allege that your opinion piece is meant so separate fact from misconception or bad data. It is your own standard you failed (and not just in the oil spill data, but in the other “factual” parts of your article).
Perhaps a bigger story is why is the BC Government relying on this old, discredited data to make decisions? Hopefully they have access to better science? Or even an interest in finding it?